Solar Energy Statistics and Solar Power Trends
The United States solar industry has increased an estimated 116% per year with 45% increases seen in a single quarter of 2012. This growth is primarily attributed to the decreasing costs for installing solar utilities, dropping 45.8% since 2010. Residential solar installations have also seen a 21.8% drop per watt. The following solar energy industry statistics are outlined below for an overview of this changing industry.
Solar Power Market Share
Although solar energy is increasing in prominence within the electricity industry, the amount of energy produced by solar power still accounts for the smallest portion over overall generation in the United States as seen in the follow distribution percentages.
Coal – 48.5%
Natural Gas – 21.6%
Nuclear – 19.4%
Hydro – 6%
Petroleum – 1.6%
Wood – 0.94%
Wind – 0.83%
Biomass – 0.40%
Geothermal – 0.35%
Other Gases – 0.32%
Solar – 0.01%
Top 5 Countries with Highest Solar Energy Use
1. Germany – 9,785 MW
2. Spain – 3,386 MW
3. Japan – 2,633 MW
4. United States – 1,650 MW
5. Italy – 1,167 MW
Renewable Energy Documentary
The below video is a documentary performed by the History Channel on the renewable energy industry.
Top 5 Corporate Users of Solar Power
According to The Solar Energy Industries Association, the following companies are considered to be the top 5 users of solar energy in corporate America.
1. Walmart – 65 MW installed.
2. Costco – 38.9 MW installed.
3. Kohl’s – 36.5 MW capacity.
4. IKEA – 79% of their stores have installed solar for a total of 21.5 MW.
5. Macy’s – 16.2 MW installed.
5 Interesting Facts About Solar Power
1. Solar and wind power energy have 100 times more energy yield than nuclear or fossil energy.
2. The earth receives more energy from the sun in a hour than is used in the entire world in a single year.
3. The area of roof space available in Australia is able to provide the nations entire electricity by using solar panels.
4. It would take 3% of the world’s land area to supply the electrical needs of the world by solar power.
5. Wind is a form of solar power generated by the uneven heating of the Earth’s surface.
The Future of Solar Power Industry
In order for solar energy to become more prominent the following technological hurdles must be surpassed.
• Solar panels must increase in efficiency by at least 20% to over 40%. This can be done by allowing for more wavelengths to be used, cheaper semiconductor methods, and more efficient manufacturing techniques used.
• Huge areas of desert can be covered in PV solar panels but must first address the environmental impacts of that.
• New direct current transmission lines can be installed that are smaller and cross the continent.
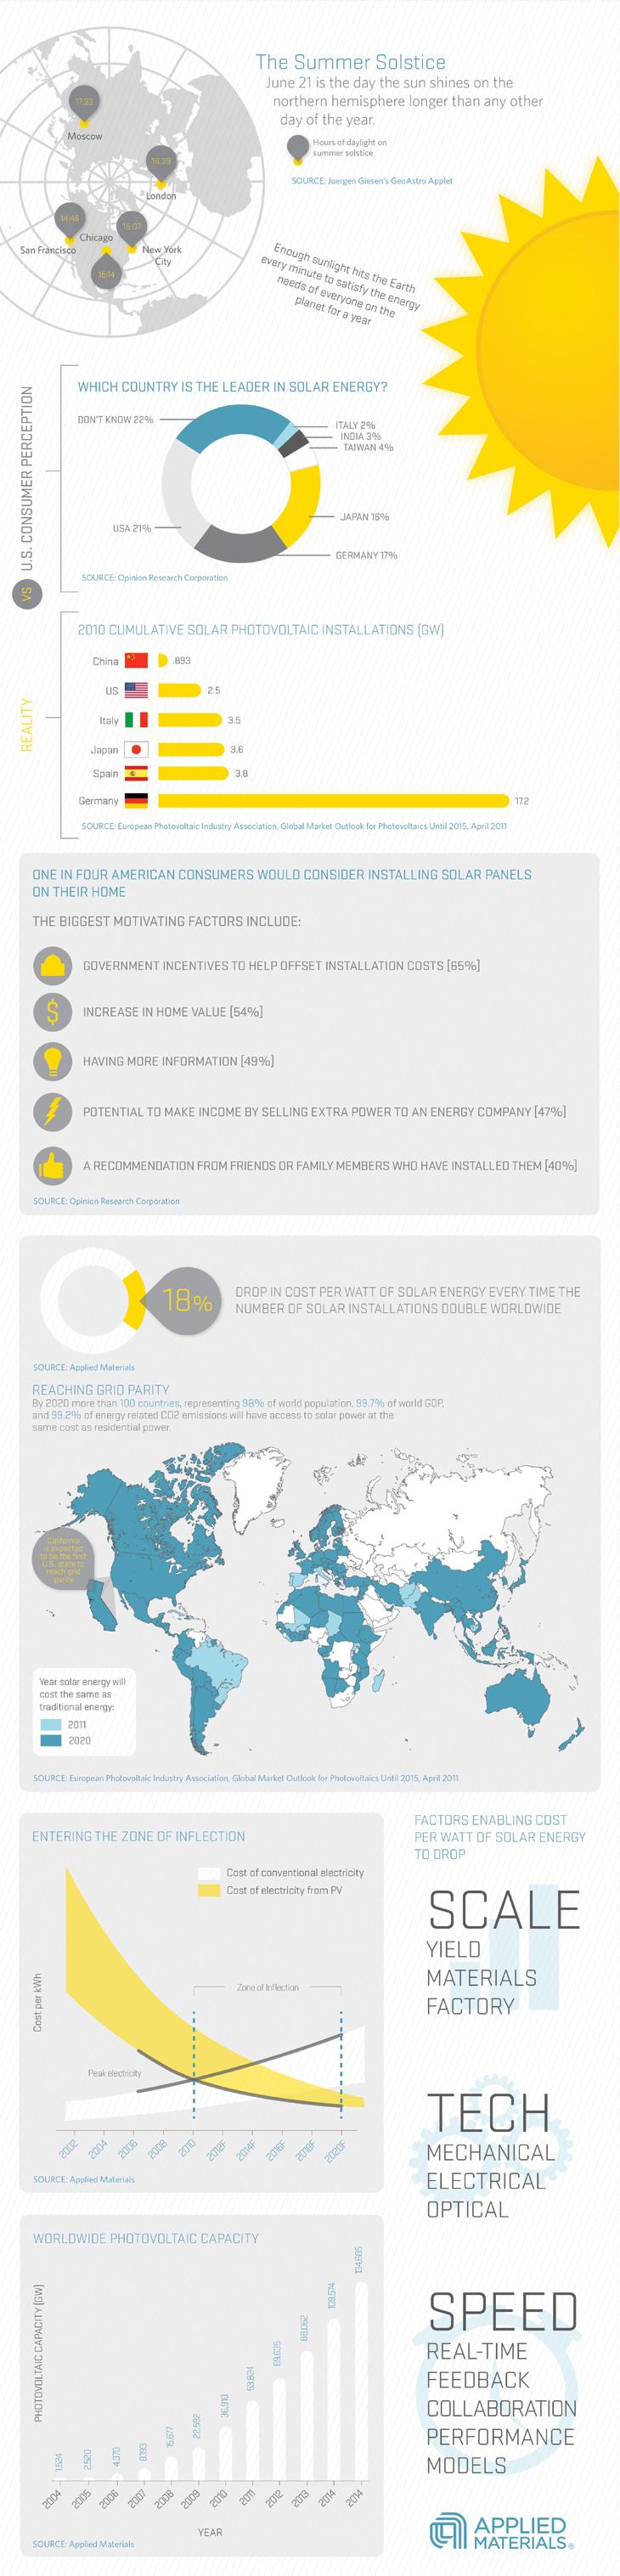
Global Solar Power Statistics
The following infographic lists statistics on the world use of solar energy and its biggest consumers. June 21st is marked as the summer solstice where the sun shines on the norther hemisphere longer than any other day of year.
Although millions of people visit Brandon's blog each month, his path to success was not easy. Go here to read his incredible story, "From Disabled and $500k in Debt to a Pro Blogger with 5 Million Monthly Visitors." If you want to send Brandon a quick message, then visit his contact page here.