Gaming Industry Statistics and Trends
The gaming industry is estimated to be worth $70.1 billion in 2015 worldwide due to the explosive growth of console, portable, PC, and online video games. The United States computer and video game software publishing industry itself employs more than 32,000 people in over 34 states. In 2009 alone, employees saw compensation upwards of $2.9 billion dollars. Total US employment by means of direct and indirect impact exceeds 120,000 workers. This industry is expected to see an 8.65% annual growth in employment, adding $4.9 billion to the US Gross Domestic Product. Additional statistics about the gaming industry are outlined below.
Gamer Demographics
1. An estimated 60% of Americans play video games.
2. The average age of game players is 30.
3. 46% of gamers are male, 54% are female.
4. The average age of a game is 37 for female and 40 for male.
5. The average US household owns at least one game console, PC, or smartphone.
6. Gamers are increasingly playing 36% of games on their smartphone and 25% on a wireless device.
7. The sale of digital format games has increased 20-40% since 2009 and physical format has declined respectively.
Age Group Game Segments
The following breakdown is by age group and percentage of gamers in the marketplace.
Age 13-18: 13%
Age 19-25: 23.5%
Age 26-35: 22%
Age 36-45: 17%
Age 46+: 24.5%
Video Game Industry Trends
The below video discuss the video game industry trends as gamers anxiously await much anticipated new releases that show the gaming market surpassing blockbuster release movie sales.
Making Money from Social Gaming
By 2014, it is estimated that 50% of social media users and 34% of total internet users will participate in some form of social gaming. This industry is broken down into the follow categories of revenue growing opportunities.
• The sale of virtual goods – 59.9%
• Advertising – 20.5%
• Lead generation or offers – 19.6%
The average amount spent per month for a social gamer is listed below.
• $1-$5 spent by 60% of users.
• $5-$10 spent by 25% of users.
• $25 or more spent by 15% of users.
Best Selling Game Segments
Video Games
The bestselling video games are action, shooter, and sports games.
Computer Games
The bestselling computer games are role playing, casual, and strategy.
Top Reasons for Purchase
Gamers top reasons for purchasing a game are based on the quality of graphics, interesting storyline, a sequel to a favorite game, or word of mouth.
Top 10 Social Game Developers
1. Zynga – $213.56 million
2. King – $99.46 million
3. Wooga – $46.56 million
4. SocialPoint – $38.99 million
5. EA Electronic Arts – $33.68 million
6. Peak Games – $28.17 million
7. Playdom – $17.87 million
8. Pretty Simple – $16.71 million
9. Fun+Game – $15.85 million
10. PopCap – $14.98 million
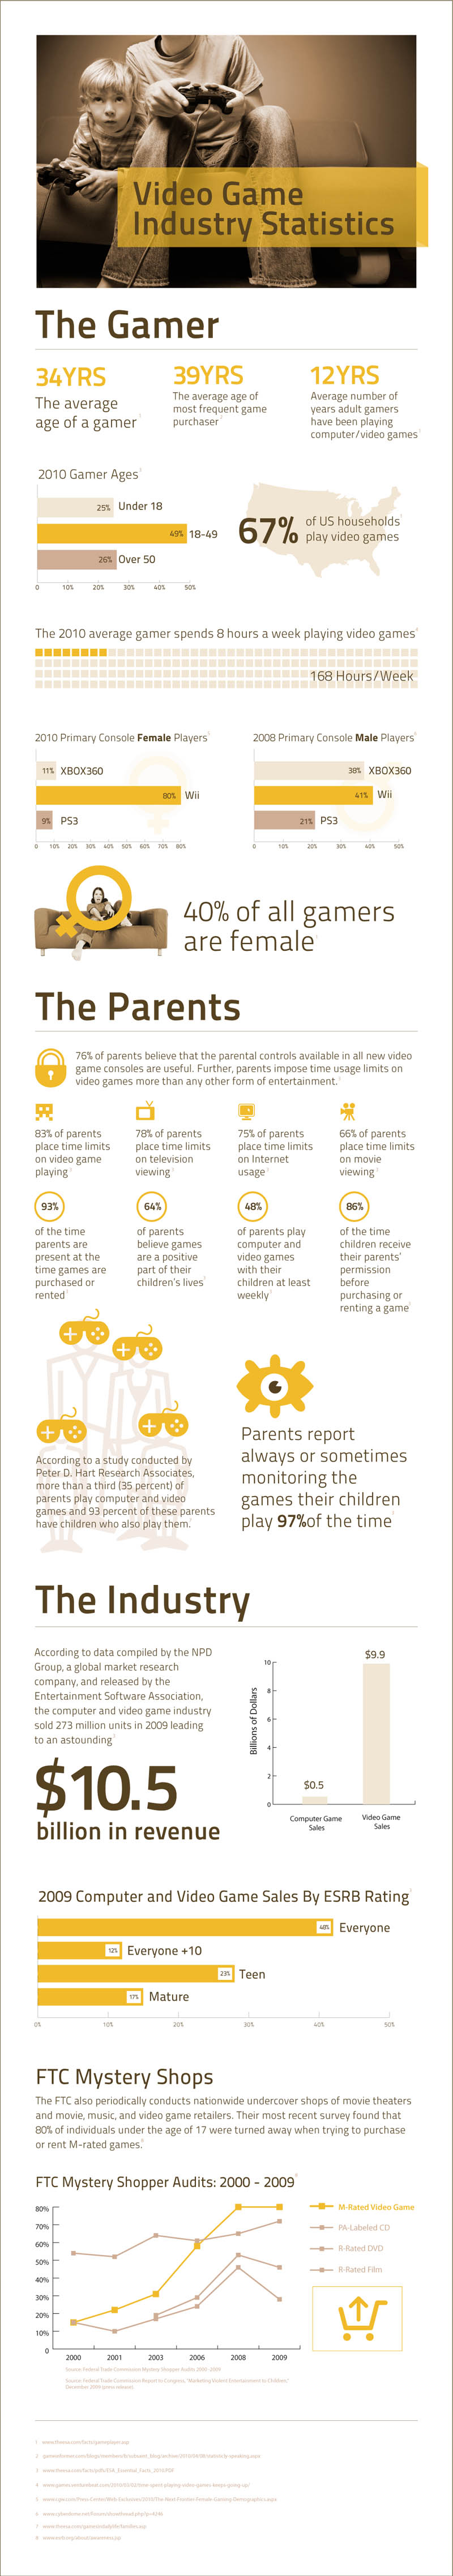
Gamer Statistics and Trends
The following infographic outlines the statistics and trends of video gamers in the United States. An average of 8 hours per week is spent on video games with 67% of American households playing some form of video game.
Although millions of people visit Brandon's blog each month, his path to success was not easy. Go here to read his incredible story, "From Disabled and $500k in Debt to a Pro Blogger with 5 Million Monthly Visitors." If you want to send Brandon a quick message, then visit his contact page here. Brandon is currently the CEO of Aided.