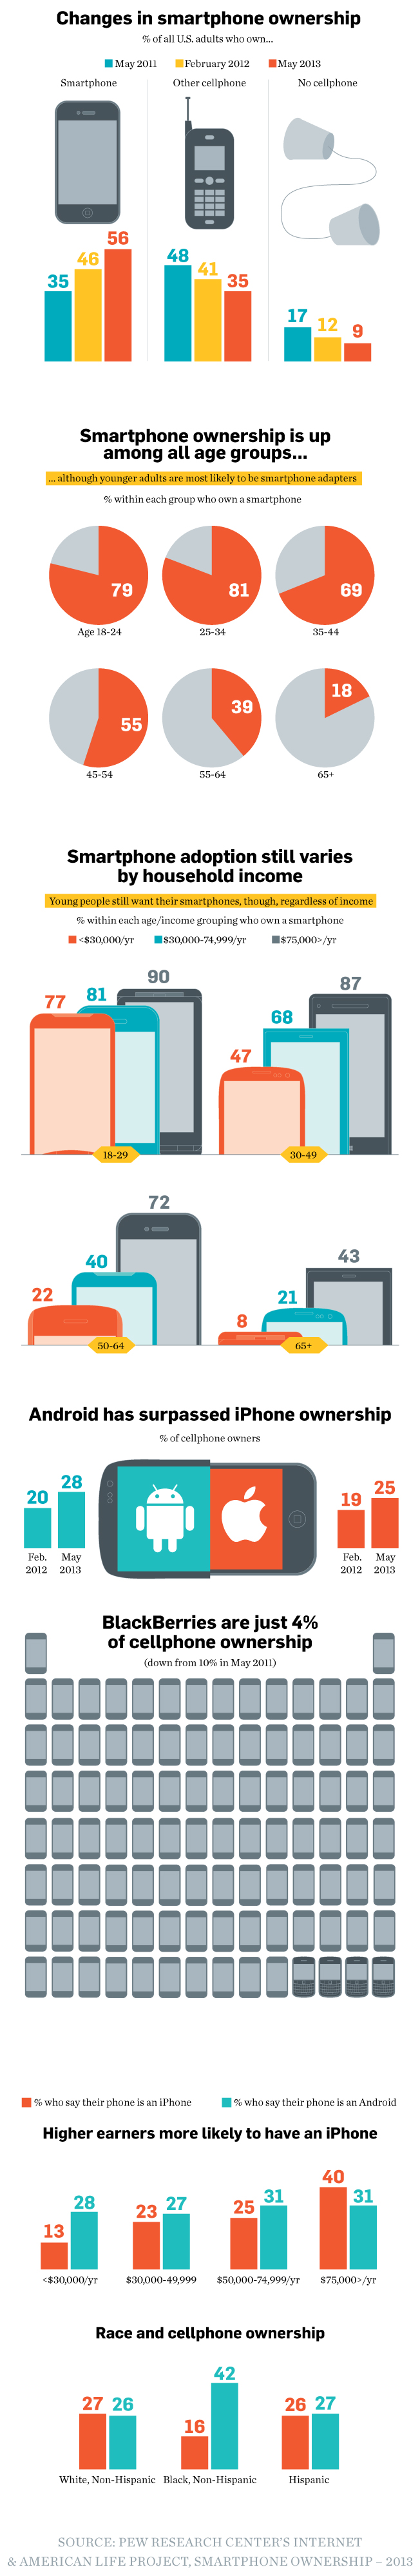
Changes in Smartphone Ownership
In the United States alone, as at May 2011, 35% of US adults owned a smartphone, 48% owned other cell phones while 17% owned no cell phone. As at February 2012, 46% of US adults owned a smartphone, 41% owned other cell phones while 12% owned no cell phone. As at May, 2013, 56% of US adults owned a smartphone, 35% owned other cell phones while 6% owned no cell phone.
Age Groups and Ownership
The ownership of smartphones is on the increase among all age groups, however, younger adults are more likely to adapt to smartphone. Here is a breakdown of the percentage of those who owned a smartphone.
• Age 18-24 – 79%
• Age 25-34 – 81%
• Age 35-44 – 69%
• Age 45-54 – 55%
• Age 55-64 – 39%
• Age 65 and above – 18%
Income Level and Ownership
The use of smartphone still varies based on the income of the household. However, youngsters want a smartphone irrespective of the income of the household. Here is the percentage of each age/income group who own a smartphone.
• For age 18-29, 77% own a smartphone with income less than $30,000 per annum, 81% with income between $30,000 and $71,999 per year own a smartphone while 90% with income above $75,000 per annum also own a smartphone.
• For age 30-49, 47% own a smartphone with income less than $30,000 per annum, 68% with income between $30,000 and $71,999 per year own a smartphone while 87% with income above $75,000 per annum also own a smartphone.
• For age 50-64, 22% own a smartphone with income less than $30,000 per annum, 40% with income between $30,000 and $71,999 per year own a smartphone while 72% with income above $75,000 per annum also own a smartphone.
• For age 65 and above, 8% own a smartphone with income less than $30,000 per annum, 21% with income between $30,000 and $71,999 per year own a smartphone while 43% with income above $75,000 per annum also own a smartphone.
Preferred Operating System
Android ownership has surpassed iPhone and Blackberry ownership is just 4% of cell phone ownership as compared to 10% as at May 2011. Here is the breakdown of the percentage ownership. In February 2012, percentage of Android owners stood at 20%, this increased to 28% in May 2013 while for Apple, it was 19% and 25% respectively between February 2012 and May 2013.
• For high earners, they are more likely to have an iPhone as for those who earn a maximum of $30,000 per year, 13% say they use an iPhone while 28% say their phone is an Android.
• For those who earned $30,000-$49,999, 23% said their phone was an iPhone while 27% said their phone was an Android.
• For earners who earned between $50,000-$79,999 per annum, 25% used an iPhone while 31% said they used an Android phone.
• For earners who earned $75,000 and above, 40% said they used an iPhone while 31% said that their phone is an Android.
Race and Cell Phone Ownership
For whites, Non-Hispanic, 27% made use of an iPhone while 26% made use of an Android. For Blacks, Non-Hispanic, 42% say they use an Android phone while 16% makes use of an iPhone. For Hispanic, 26% say they use an iPhone while 27% say that they use an Android.
Although millions of people visit Brandon's blog each month, his path to success was not easy. Go here to read his incredible story, "From Disabled and $500k in Debt to a Pro Blogger with 5 Million Monthly Visitors." If you want to send Brandon a quick message, then visit his contact page here.