Gun Ownership Statistics in the US
Firearms are classified as handguns, rifles, and shotguns. In the United States over 300 million people own firearms. Of this, 100 million own handguns. The following statistics portray current gun ownership statistics in the US.
1. 40-45% of 47-53 million Americans have a household with a gun.
2. 30-34% of 70-80 million Americans own a gun.
3. 17-19% of 40-45 million adults own a handgun.
Gun Ownership Based on Category
Households – 42%
Individuals – 30%
Male – 47%
Female – 13%
White – 33%
Non-White – 18%
Republican – 41%
Independent – 27%
Democrat – 23%
Reasons for Ownership
Protection Against Crime – 67%
Target Shooting – 66%
Hunting – 58%
Top 10 Countries with Highest Gun Ownership
The following video takes a look at the current statistics of the top ten countries with gun ownership.
Gun Crimes
1. 67% of murders are committed with firearms.
2. 8% of violent crimes are committed with offenders visibly armed.
3. Civilians defend themselves with guns an estimated 989,883 times per year.
4. Americans used guns to frighten away intruders 498,000 times per year from breaking into their home.
5. 40% of felons decided not to commit a crime because they knew or believed a victim was carrying a fun.
6. 69% of felon criminals have been scared off or shot at by an armed victim.
7. The current homicide rate estimates that 240 Americans will be murdered with a firearm.
Right to Carry Laws
1. 40 states have shall issue laws where concealed permits are issued to qualified applicants.
2. 9 states have may issue laws for those with issuing authority and reasoning for carrying a firearm.
3. 1 state has a no issue law where right to carry a concealed weapon is forbidden in Illinois.
Fatal Gun Accidents
Of the 613 fatal firearm accidents in the United States, this is broken down to the following age groups and percentages.
1-4 years old – 1.1%
5-9 years old – 2.1%
10-14 years old – 2.1%
15-24 years old – 1.0%
25-34 years old – 0.6%
35-44 years old – 0.5%
45054 years old – 0.4%
55-64 years old – 0.5%
65 years and older – 0.2%
Education Level of Gun Owners
College Post Graduate – 30%
College Graduate – 37%
Some College – 41%
High School Graduate or Less – 42%
Income of Gun Owners
$75,000 a year – 47%
$50,000 a year – 49%
$30,000 a year – 44%
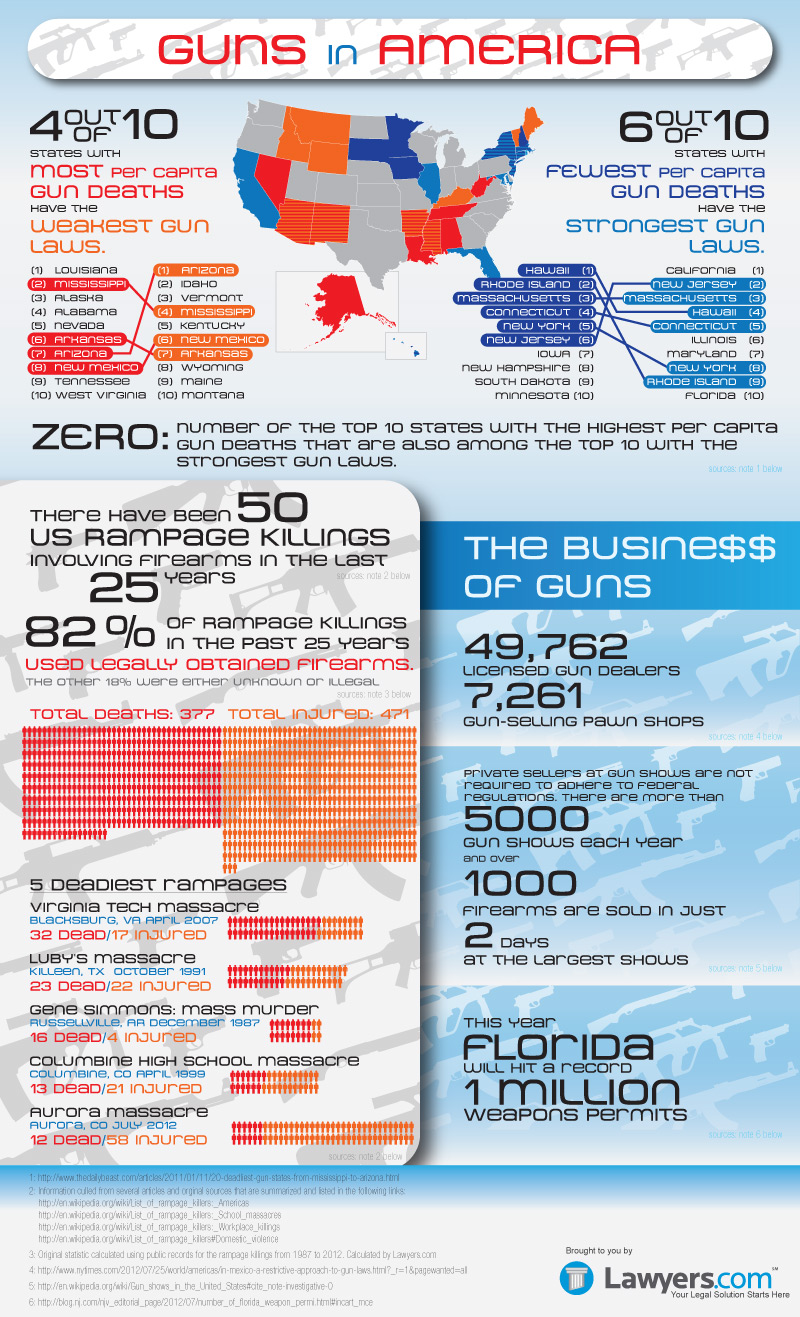
Gun Industry Statistics
The following infographic outlines current statistics of the gun industry. With almost 50,000 licensed gun dealers in the United States, Florida will hit a record 1 million issued weapons permit and be crowned as the largest armed States in the US. Of the 5,000 gun shows that occur each year, approximately 1,000 firearms are sold in just 2 days.
Although millions of people visit Brandon's blog each month, his path to success was not easy. Go here to read his incredible story, "From Disabled and $500k in Debt to a Pro Blogger with 5 Million Monthly Visitors." If you want to send Brandon a quick message, then visit his contact page here.