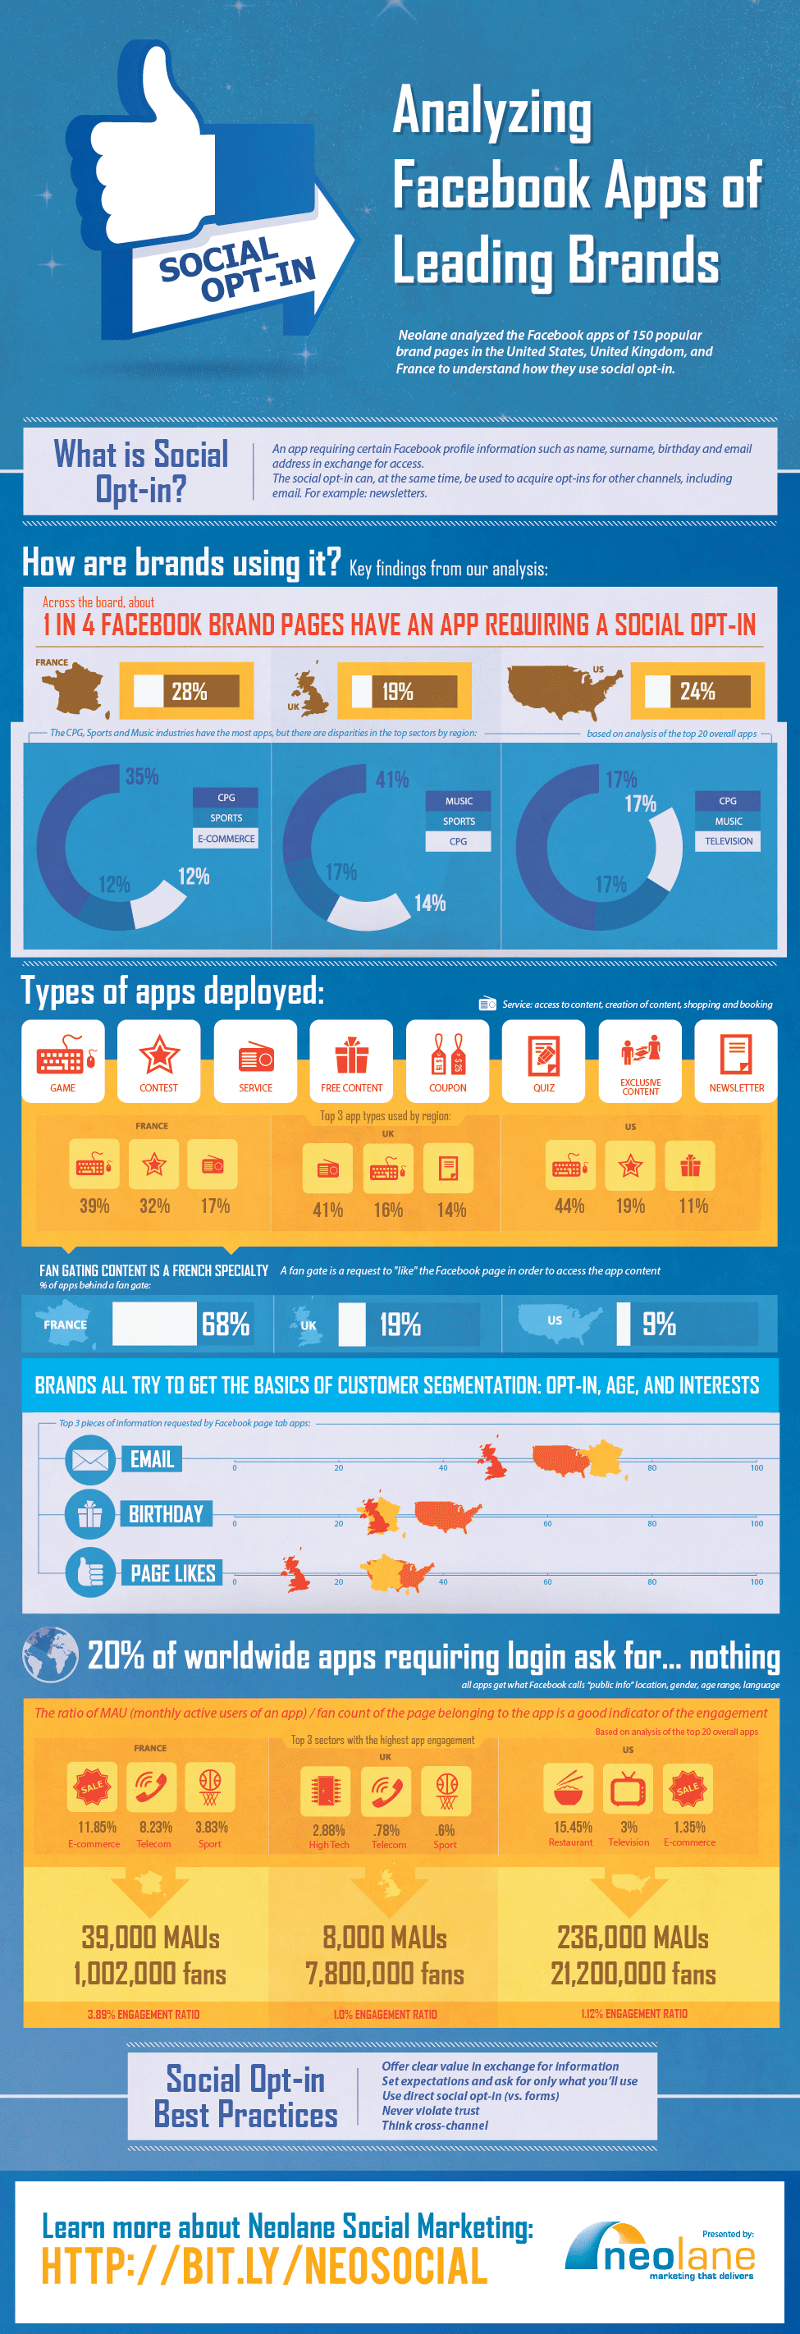
Analyzing Facebook Apps of Leading Brands
There are Facebook applications for approximately 150 brand pages in the United States, United Kingdom, and France. The purpose of this analysis is to understand how they made use of social opt ins.
What is Social Opt In?
These are application that require the import of Facebook profile information such as names, surnames, email address, and date of birth before access is granted to the visitor. It can also be simultaneously gain opt in for other platforms such as newsletter.
How Brands Make Use of It
Results from surveys conducted reveal the following. For all companies surveyed for every four Facebook branded pages, one has an application that requires a social opt in. Here is the breakdown.
France: 28%
United Kingdom: 19%
United States: 24%
It was discovered that those that have the most applications are the Sports, Music, and CPG industries. In the top regions there are disparities. From an analysis of the top 20 apps here is the breakdown.
France:
CPG – 35%
Sports – 12%
eCommerce – 12%
United Kingdom:
Music – 41%
Sports – 17%
CPG – 14%
United States:
CPG – 17%
Music – 17%
Television – 17%
In this industry, there are various types of applications that are deployed. They are service access content, creation of content, shopping and booking. Here they are: Games, Contest, Service, Free Content, Coupon, Quiz, Exclusive Content, and Newsletters.
Here are the top three applications used based on regions.
France:
1. Games – 39%
2. Contest – 32%
3. Service 17%
United Kingdom:
1. Service – 41%
2. Game – 16%
3. Newsletters – 14%
United States:
1. Games – 44%
2. Contest – 19%
3. Free Content – 11%
In France, fan gating is a specialty. A request to be like the fan page in order to access content is referred to as fan gating. Here is a percent of applications behind the fan gate.
1. France – 68%
2. United Kingdom – 19%
3. United States – 9%
Different brands are interested in getting basics of customer segmentation, opt in age, and interest. Areas of interests are emails birthdays and page likes.
The study revealed that 20% of the world wide applications requiring login ask for nothing. It is also discovered that all applications have what is referred to as public info, location, gender, age range, and language by Facebook.
It was discovered that a good indicator of the engagement is the ratio of the monthly active users of an application and the fan count of the page belonging to the application.
Here are the top three sectors with the highest app engagement based on the analysis of the top 20 overall apps.
France:
Ecommerce – 11.85%
Telecom – 8.23%
Sport – 3.83%
United Kingdom:
High Tech – 2.88%
Telecom – 0.78%
Sports – 0.6%
United States:
Restaurants – 15.45%
Television – 3%
Ecommerce – 1.35%
From France, we have 39,000 MAUs and 1,002,000 fans, this translates to 3.89% of engagement ratio. From the United Kingdom, we have 8,000 MAUs and 7,800,000 fans, this translate to 1.0% engagement ratio while for the United States, we have 236,000 MAUs and 21,200,000 fans, translating to 1.12% engagement ratio.
Here are some best practices associated with Social Opt in.
1. In exchange for information, clear value should be offered.
2. Request for only useful information as you set expectation for all involved.
3. Make use of direct social opt in forms.
4. Always respect trust.
5. Think across all channels.
Although millions of people visit Brandon's blog each month, his path to success was not easy. Go here to read his incredible story, "From Disabled and $500k in Debt to a Pro Blogger with 5 Million Monthly Visitors." If you want to send Brandon a quick message, then visit his contact page here. Brandon is currently the CEO of Aided.