Food and Beverage Industry Statistics
According to Plunkett Research, the food and beverage industry is estimated to be worth $450 million Food retailing is considered one of the most diverse and sophisticated emerging markets with association to over 50,000 non-traditional food sellers. The overall food industry has remain dominated by a handful of companies as listed below.
• Unilever
• Cadbury Schweppes
• H.J Heinz
• Kraft Foods Group
• Mendelez International (Formally Known as Kraft Foods, Inc.)
• General Mills
• Nestle
Revenue Growth
The following list has been the ten primary drivers to growth throughout the food and beverage industry.
1. Product Innovations – 38%
2. Adding Customers – 35%
3. Alternative Sales Channels and Distribution – 25%
4. Healthier Product Alternatives – 23%
5. Merger and Acquisition Activity – 20%
6. Core Market Expansion – 19%
7. Emerging Markets – 18%
8. Retaining Customers – 18%
9. Economic Conditions Improving – 17%
10. Increased Consumer Spending – 17%
Barriers to Industry Growth
Over half of the industry businesses suffer from the following barriers to growth.
1. Pricing Pressures – 51%
2. Volatile Commodity/Input Prices – 31%
3. Labor Costs – 28%
4. Regulatory and Legislative Pressures – 21%
5. Lack of Customer Demand – 16%
6. Energy Prices – 15%
The Growing Beverage Industry
The following video discuss the growing trends of the beverage industry.
Technological Influence and Trends
The food and beverage industry has seen increasing impacts made by to their marketing strategies based on the following.
1. Social Media – 46%
2. Mobile/Online Engagement – 45%
3. Mobile/Online Promotions – 31%
4. Mobile/Online Shopping – 24%
5. Comparison Pricing and Products – 23%
6. Peer Rankings and Reviews on Purchase Decisions – 19%
The overall food and beverage industry is expecting to invest 33% into the acquisition of new businesses and 31% into expanding current facilities. Future spending is categorized into the additional following areas of this industry.
1. New Products or Services – 28%
2. Information Technology – 24%
3. Advertising and Marketing Branding – 20%
4. Employee Compensation and Training – 17%
5. Business and Model Transformation – 13%
Geographic Expansion
An estimated 48% of companies are planning to geographically expand their business within the food and beverage industry. This is broken down into the following sectors.
• 20% plan to geographically expand within the United States.
• 17% plan to geographically expand to a high growth emerging market outside of the United States.
• 11% plan to geographically expanding into developing markets outside the United States.
Regulatory Influence
The following regulations and mandates have become a core focus of the food and beverage industry.
1. Food Safety Modernization Act – 82%
2. Healthcare Reform – 38%
3. Product Recalls – 36%
4. Labor/Immigration Laws – 20%
5. Dodd-Frank Conflict Minerals – 6%
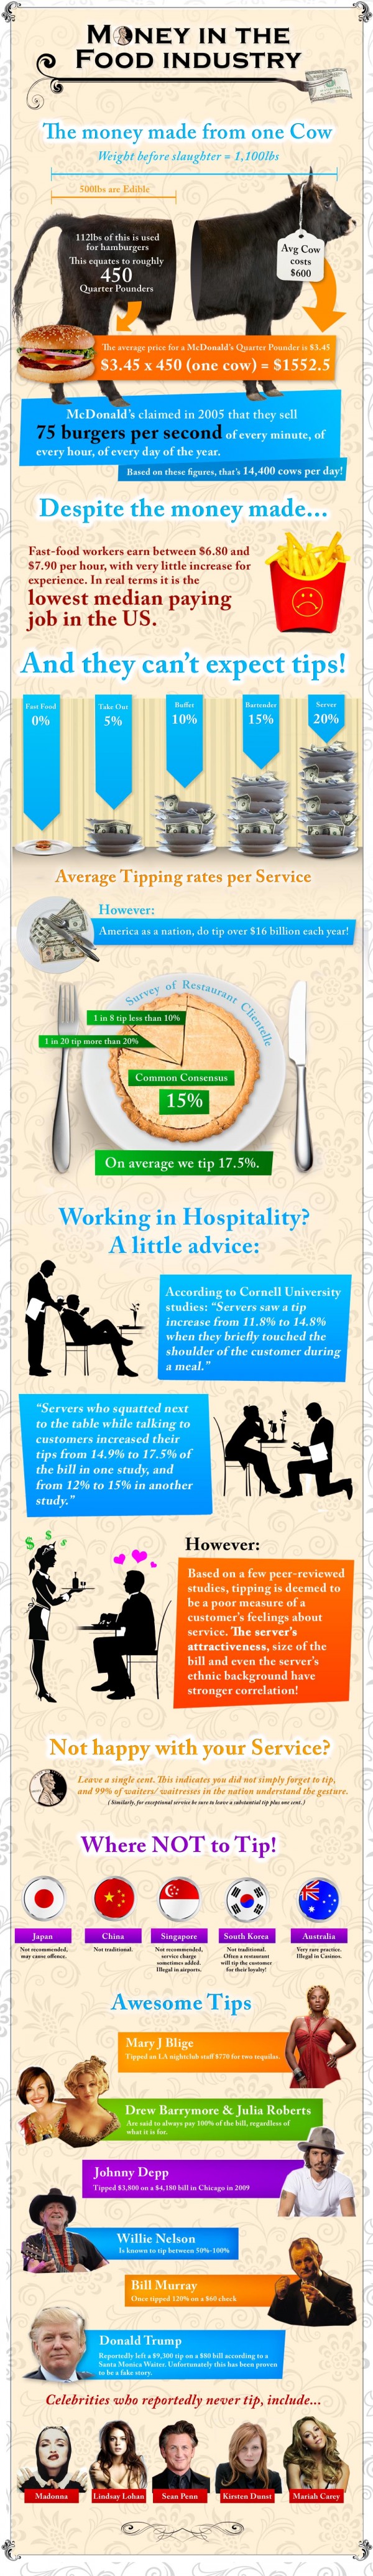
The Food Industry in Just a Single Cow
The following infographic outlines the money that is made from one cow within the food industry. Based on the sales McDonald’s sees on a daily basis for hamburgers, an average of 14,000 cows are killed daily to meet this need.
Although millions of people visit Brandon's blog each month, his path to success was not easy. Go here to read his incredible story, "From Disabled and $500k in Debt to a Pro Blogger with 5 Million Monthly Visitors." If you want to send Brandon a quick message, then visit his contact page here. Brandon is currently the CEO of Aided.