UK Social Media Habits And Privacy Concerns Statistically Speaking
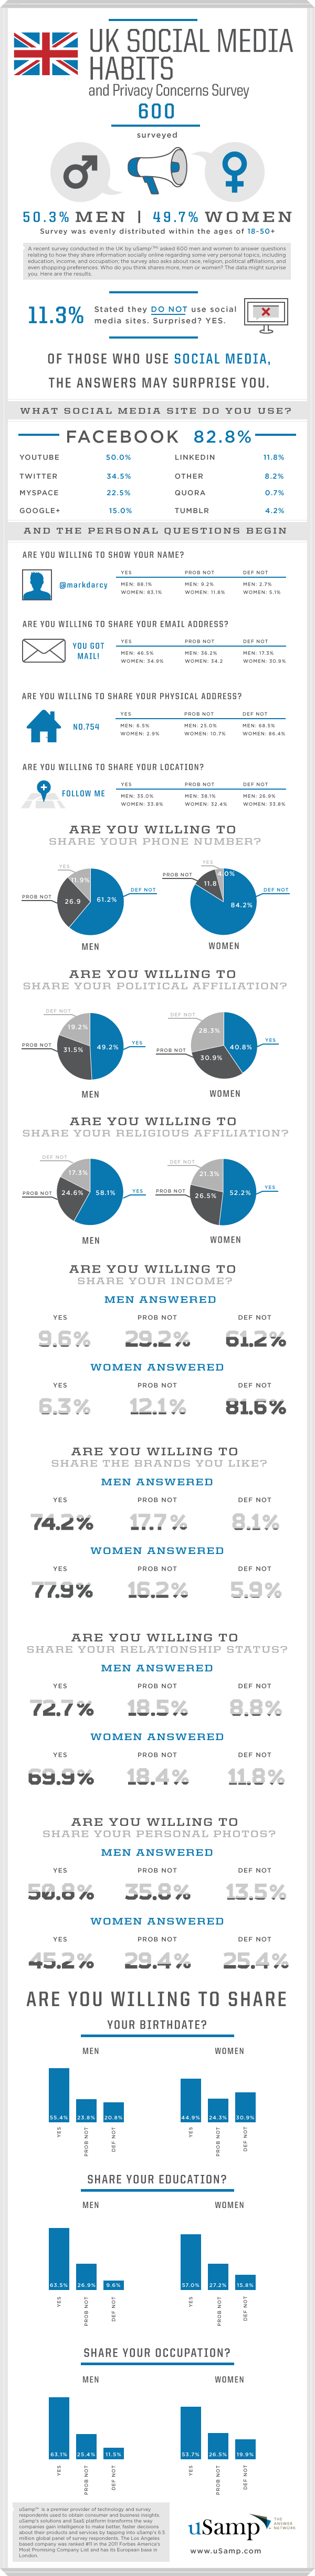
The survey included 600 individuals form the UK with that ranged in age between 18 and 50 of which 50.3% where men and 49.7% where women. This group was asked questions about how they share information socially online. Do they participate in social medial sites if the share information such as education, income and occupation. The survey went as far as to ask questions about race, religion, political affiliation and shopping preferences.
Statistics
A surprising 11.3% said they did not participate in social media. Yes the remaining percentage of the 600 survey widely participated in social media and you may be shocked at how much and what kind of information they are willing to share. Let’s take a closer look at who is sharing what with whom.
Preferred Site
What medial sites are most visited by those surveyed? FACEBOOK is at the top of the list at 82.8% and YOUTUBE comes in at 50%, no surprises here. Twitter was used by 34.5% and the rest of the media sites in order of percentage of social interaction where MYSPACE 22.5%, GOOGLE + 15%, LINKEDIN 11.8%, OTHER 8%, QUORA 0.7% and TUMBLR 4.2%.
Getting Personal
Now the personal questions begin, with 88.1% of men and 83.1% of women willing to display and share their name with others they do not personally know. Are you willing to share your email address, 46.5% of men and 34.9% of women said yes, probably not received 36.2% & 34.2% and definitely not received 17.3% & 30.9% among men and women respectively. Not as surprising a response to are you willing to share your physical address no was the response of 65.5% of men and no was the response of 86.4% of women. Yet at the same time 38.1% of men and 32.4% of women were willing to share their overall geographic location.
Along the same lines 11.9% of men and 4% of women are willing to share their phone numbers. Are you willing to share your political affiliation received a greater positive response with 49.9% of men and 40.8% of women said yes they would open share their political views. Are you willing to share your religious affiliation found that 58.1% of men and 52.2% of women are openly willing share their religious views on social media sites.
Both men and women are less likely to share their income level with 9.6% of men and 6.3% of women saying yes they would share their income information with others. On the other hand when it comes to brand preference and relationship status both men and women are much more open, with 74.2% & 77.9% willing to share brand preferences and 72.7% & 69.9% of men and women willing to share relationship status openly. On a more conservative level was the question about sharing personal photos outside their personal social spears, with 50.8% men willing to share and 45.2% of women willing to share personal family photos.
The last big three pieces of personal information birthday, education and occupation. 55.4% of men are openly willing to share their birth date and 44.9% of women also are willing to share their birth date openly during social media interactions. Education seems to be ok to share openly as well with 63.5% of men and 57% of women openly discussing their educational accomplishments online. Just as open with their occupation 63.1% and 53.7% of women exchange information about what they do openly.
Although millions of people visit Brandon's blog each month, his path to success was not easy. Go here to read his incredible story, "From Disabled and $500k in Debt to a Pro Blogger with 5 Million Monthly Visitors." If you want to send Brandon a quick message, then visit his contact page here. Brandon is currently the CEO of Aided.