Hard cider is an alcoholic beverage made from apples that is enjoyed around the world, although the primary markets are in Europe and the United States. In 2013, total sales for the industry reached $595 million, with the sales volume of cider rising by 11.8% in the U.S. market. Total sales in the United States in 2014 were $378 million, while in 2015 they were $536 million, accounting for about 40% of the total industry.
The total value of the global cider market, however, is estimated to be more than $16 billion.
From 2015 data, Angry Orchard was the most popular brand of hard cider on U.S. shelves, producing over $250 million in sales. That equates to about 7.3 million cases of hard cider being sold. Owned by the Boston Beer Company, more cases of Angry Orchard were sold in 2015 than the next 19 most popular brands in the United States that year.
Important Hard Cider Industry Statistics
#1. New York is the leading state for cideries, with 72 registered producers currently operating. Across the country, the United States has more than 800 cideries that produce at least one hard cider product for sale. (Statista)
#2. Although Angry Orchard controls a 58% market share of the U.S. hard cider industry, there are disruptors who are making an impact. The volume sales growth of Citizen Cider was 235% from 2014 to 2015. Citizen Cider also saw sales growth of 209%. (Statista)
#3. U.S. apple production rates currently stand at 5.7 million tons per year. (Statista)
#4. In the United States, the average adult consumes about 9.2 liters of alcohol per year. The reason why hard cider has such growth potential is that the average cider consumption rates in the U.S. are 59 liters per person. (Statista)
#5. For the U.S. cider market, local and regional cideries make up 25% of the total revenues that are generated by the industry each year. (Statista)
#6. In 2017, the hard cider market in the United States dropped from $536 million to $470 million. During this time, however, the smaller brands within the industry actually grew. In 2016, the smaller brands experienced 41% growth, and in 2017, they experienced 30% growth. (Forbes)
#7. In 2017, on-premise sales of hard cider products fell almost 5%, which is concerning since most cider drinkers are very active on-premise. Hard cider industry customers spend 32% more than the average consumer on-premise and 13% more than the average beer drinker. (Forbes)
#8. About 4% of legal-age consumers of alcoholic beverages say that hard cider is their beverage of choice, which is up from 1% of consumers in 2007. (Forbes)
#9. The hard cider industry currently controls about 0.4% of the alcoholic beverage industry. In 2002, the industry held a 0.06% share of the industry. (Forbes)
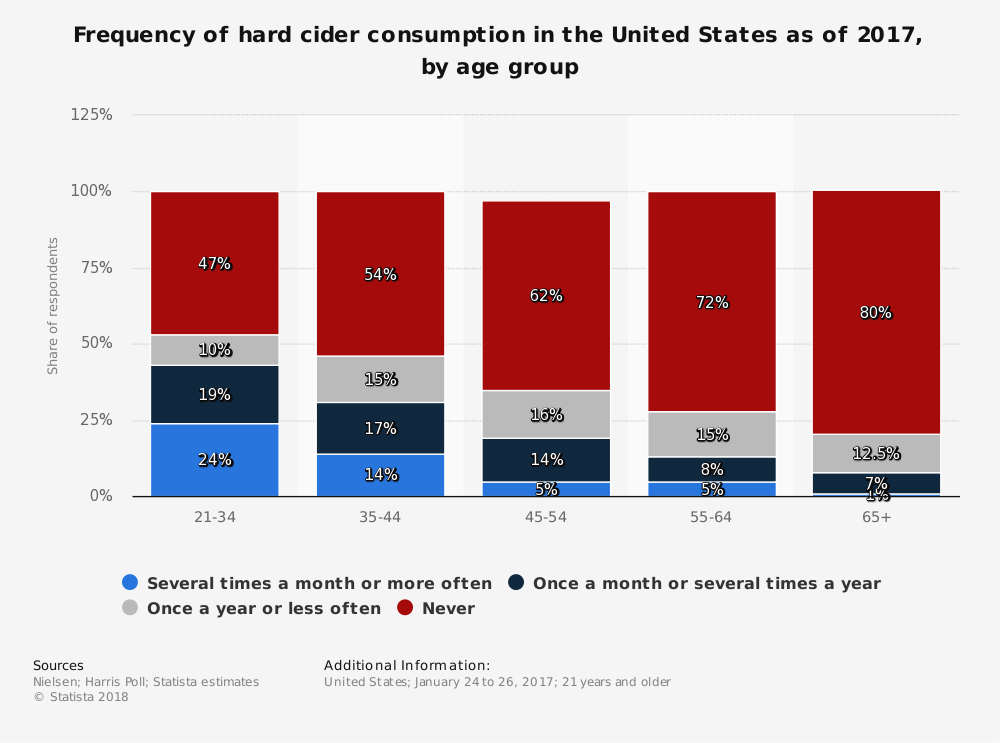
#10. Baby Boomers and Millennials are both responsible for drinking about one-third of the cider that is consumed each year. Men and women drink hard cider equally. (Forbes)
#11. 37% of consumers who purchase alcoholic beverages in the 25-49 age demographic said that they were unable to name a hard cider brand. (Draft Magazine)
#12. Although on-premise sales have been declining in recent years, off-premise retailers have seen a surge of growth in the hard cider category. Sales at grocery stores, convenience stores, supermarkets, and similar locations rose by 39% from 2015 to 2016 in the United States. (Draft Magazine)
#13. Hard cider’s share of sales at bars and restaurants is just 1.3% the size of the share beer holds within this section of the industry. Only Washington, Oregon, Virginia, Vermont, and Maine have hard cider holding a 3% or greater share compared to the size of beer sales. (Draft Magazine)
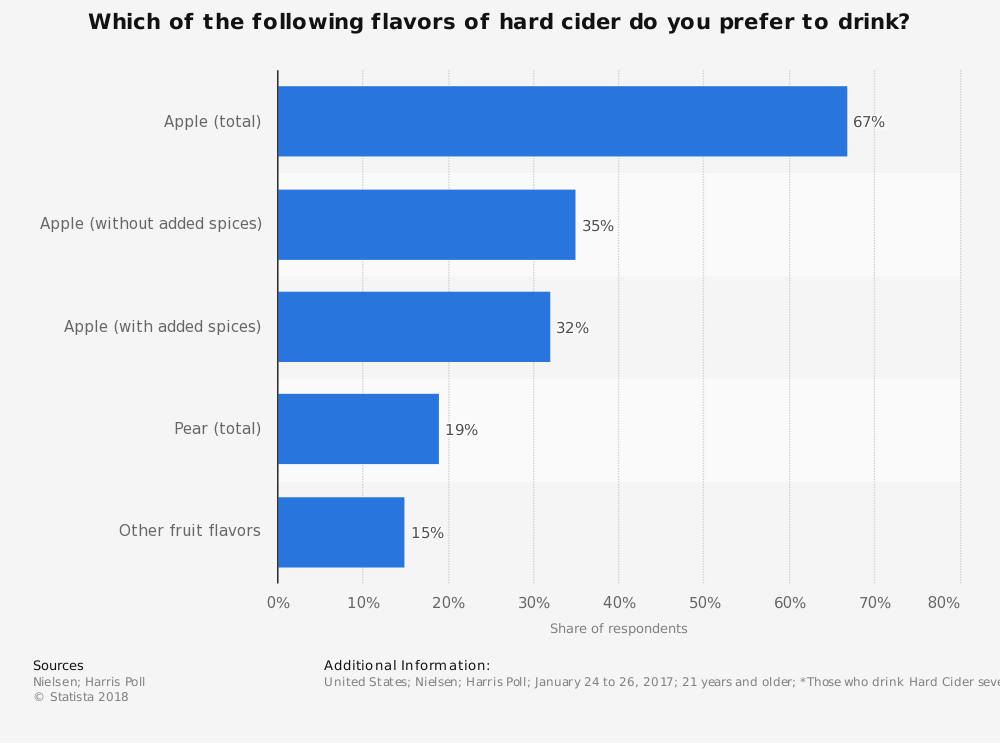
#14. Flavored cider beverages currently represent 16% of the industry revenues which are generated each year. From 2015 to 2016, the growth of flavored hard cider was 4%. Popular flavors include cranberry, cherry, pineapple, and honeydew melon. (Draft Magazine)
#15. About 7,500 different varieties of apples are grown throughout the world. Around 2,500 of those varieties are currently grown in the United States. (University of Illinois)
#16. The largest crop of apples ever harvested in the United States came in 1998, when there were 277.3 million cartons available for the market. (University of Illinois)
#17. The average size of an apple orchard in the United States, including cideries who produce their own apples, is 50 acres. (University of Illinois)
#18. 36% of apples are processed into some type of apple product. About 19% of the harvest each year is dedicated to either juice, cider, or hard cider production. Although New York leads in cideries, Washington produces the most apples, accounting for 58% of the fruit produced in any given year. (University of Illinois)
#19. About 379,000 acres of land are currently dedicated to apple orchards in the United States, with about 7,500 active apple growers contributing to the industry in some way. (University of Illinois)
#20. About 25% of the apples that are grown in the United States are exported each year. Red Delicious apples are the most popular, with over 60 million bushels harvested annually. (University of Illinois)
#21. Apple trees are the most common fruit tree that you will find in Europe, with over 450,000 hectares of land dedicated to apple growth. Poland is the leading producer of apples in the European Union. (Eurostat)
Hard Cider Industry Trends and Analysis
After more than a decade of slow, but steady increases in sales, the past 5 years have been a rollercoaster of growth and losses for the hard cider industry. What is unique about this industry is that the preference for small producers restricts growth of the large producers, then the preferences flip and the preference for large producers takes away growth for the regional and local cideries.
This trend should begin to stabilize in 2019 as apple production rates continue to rise and local orchards begin producing their own on-premise supply to create cider. Although consumers will still bounce from one brand to another, new products within the industry, such as the Rose cider introduced by Angry Orchard, will drive consumers back to this product.
The long-term growth trends have been encouraging and should continue to stay that way. Although hard cider will still not exceed a 1% market share of the alcoholic beverage industry by 2024 (or even 2029), look for the industry to exceed a 0.6% market share for the first time. Revenues should also rebound, with the U.S. industry breaking through the $600 million barrier within the next 5 years.
Although millions of people visit Brandon's blog each month, his path to success was not easy. Go here to read his incredible story, "From Disabled and $500k in Debt to a Pro Blogger with 5 Million Monthly Visitors." If you want to send Brandon a quick message, then visit his contact page here. Brandon is currently the CEO of Aided.