Infographics And Marketing Strategies 101
The notion that light travels faster than sound has been common knowledge for thousands of years. The brain processing graphics 60,000 times faster than text is a fact that has been realized within our generation.
Brain retention studies are helping us understand how our minds work. Marketing professionals are using the emerging data to change the way they target customers.
Communication
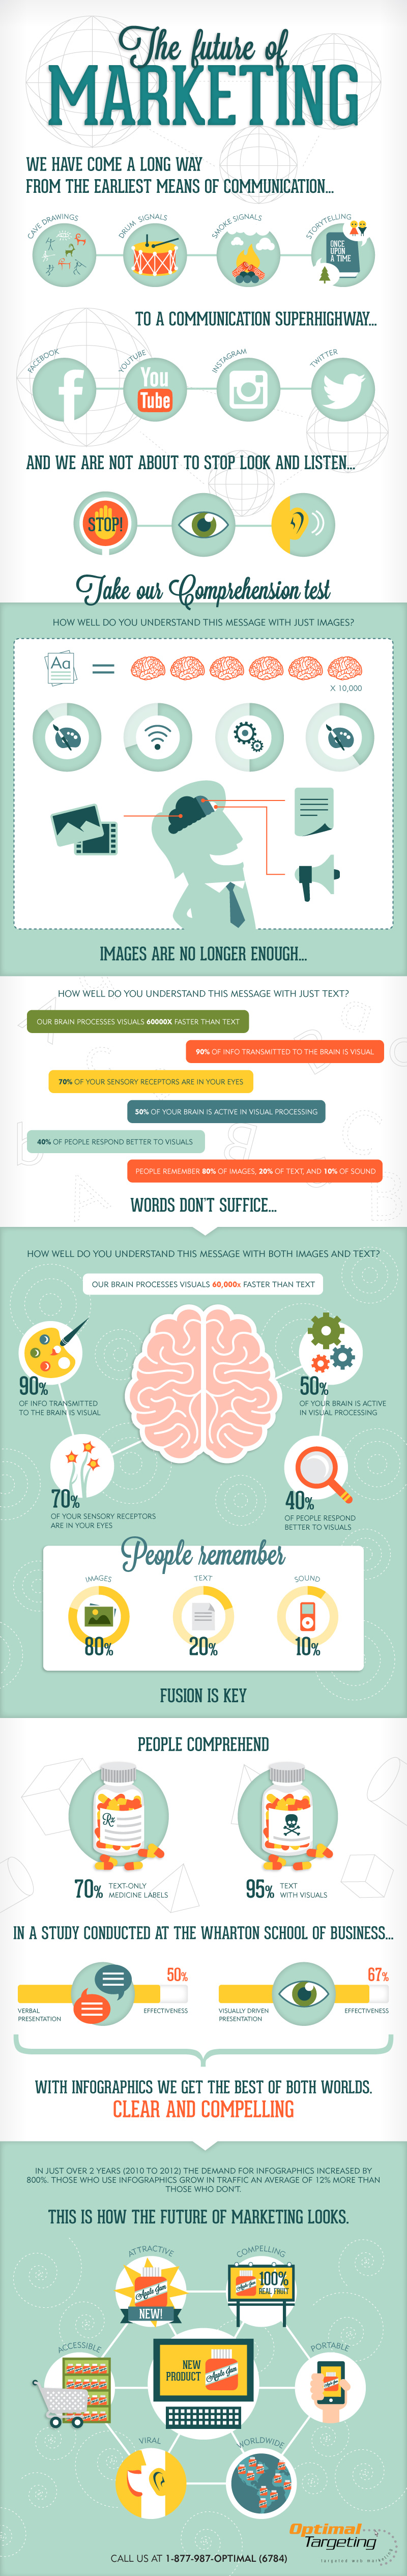
Communication has gone through many changes from the days of cave drawings, smoke signals and storytelling to the current era of the superhighway. Along this new path communication norms are being redefined annually.
The inception of the computer not only made the world smaller but created a foundation for individuals to build digital access points to communicate ideas and services. These access points form networks which makes data accessible to individuals with adequate resources and an intent to receive information. The ongoing challenge for digital engineers has been delivering data in a clear and concise manner, while using the least amount of resources as possible (e.g. bandwidth, memory etc).
When marketing professionals factor that 90% of the information that is transmitted to the brain is visual and 70% of our human sensory receptors are in our eyes. We better understand why they continuously revisit different ways to target consumers.
Verbal and Visual Presentations
The Wharton School of Business research has found that verbal presentations effect the brain by 50% and visual presentations effect the brain by 67%.
This has proliferated the concept of integrating infographics into the culture of electronic data exchange. This method exploits the brains visual system to recognize patterns and comprehend complex information quickly. This approach is gaining momentum and marked an 800% increase in demand between 2010-2012.
Infographics combines verbal and visual presentation methods to have a greater impact on the consumer. Statistics demonstrate that people remember 80% of images, 20% of text and 10% of sound.
Marketing strategist are benefiting from the research and invest in resources to produce a collective cache of infographics as an emerging method of communication.
The criteria for infographics is visual elements, content and knowledge. When designed as a presentation infographics typically fit into two graphical categories: theme and reference. Theme graphics exist in all infographics and represent the visual aspect of data. Reference graphics are the icons that are optional elements of infographics. The underlying principle that supports the theme is knowledge which gives insight into the data that is represented.
The enhancement of computer technology and mobile devices serves as the portable “blackboard” that displays data in a contemporary style (infographics). This expedites the distribution of information in a manner that enables the recipient to grasp concepts quicker than linear (text) and auditory forms of communication.
The use of infographics is integrating into society with increased use in television, social media, print, occupational and educational outlets.
Although millions of people visit Brandon's blog each month, his path to success was not easy. Go here to read his incredible story, "From Disabled and $500k in Debt to a Pro Blogger with 5 Million Monthly Visitors." If you want to send Brandon a quick message, then visit his contact page here.