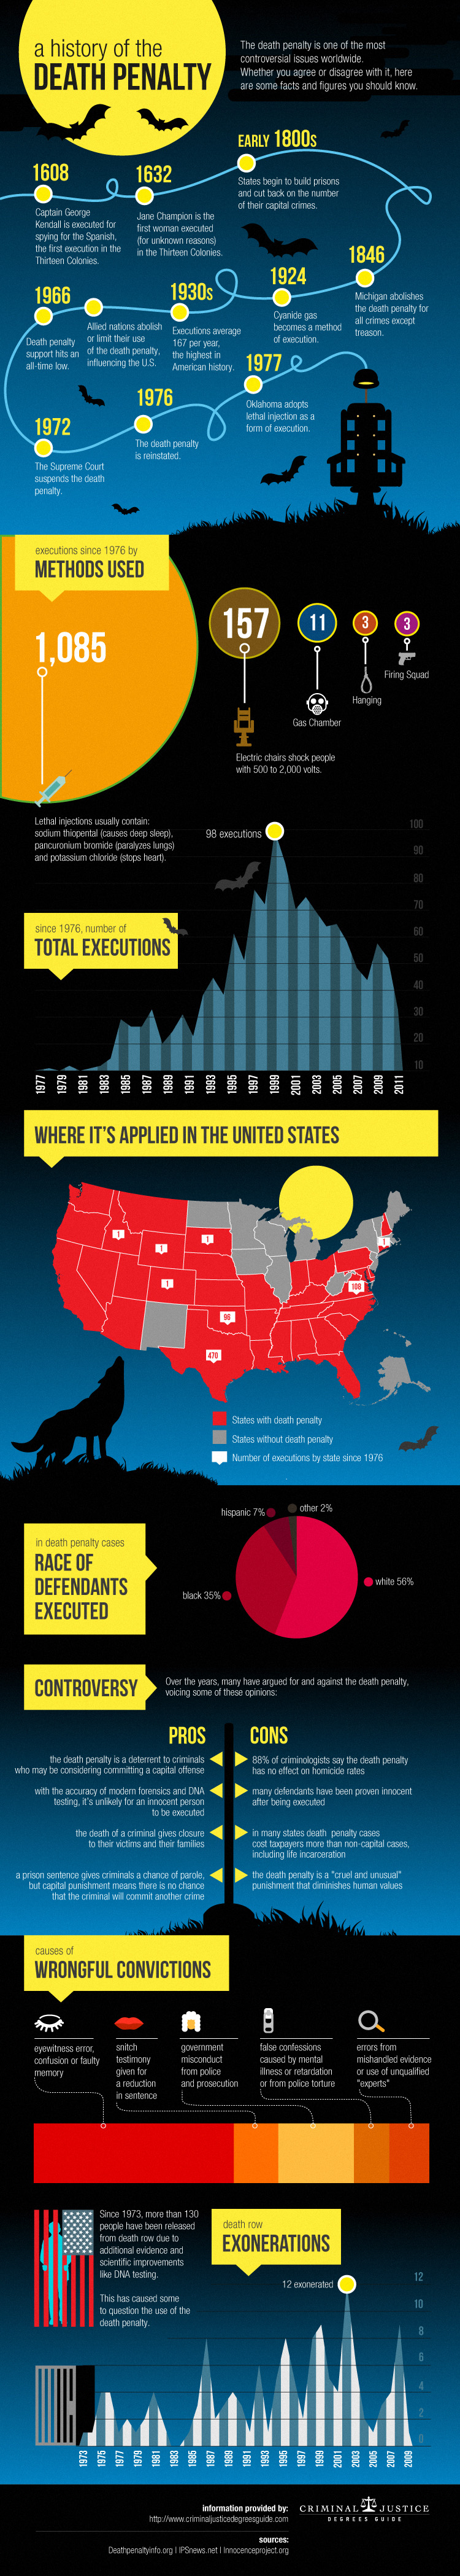
The death penalty is an often contentious issue in countries that still have these laws on the books. Whether you are for or against the death penalty, these statistics may make you think twice about your position. There are currently 32 states that authorize the death penalty and since 1976, 1,369 people have had their sentences to die be fulfilled.
The Influence of Race
Race plays a major role in the death penalty. This is substantiated by the following statistics.
1. In 96% of states that have reviewed a link between the death penalty and race, there was a pattern of race-of-victim discrimination, race-of-defendant discrimination, or both.
2. Only 2% of the chief district attorneys in states that have authorized the death penalty are of a minority race.
3. In North Carolina, it was determined that the odds of receiving the death penalty were 3.5 times greater if the victim in a crime was white.
Takeaway: Race is always a divisive topic, but the statistics don’t lie. Race does play a role in the death penalty and that means a second or even a third look at a case before assigning it with charges that qualify for the death penalty makes sense.
Additional Death Penalty Statistics
1. Since 1976, 143 people have been exonerated from death row because of evidence of their innocence.
2. Florida has set free the most people from death row because of being wrongly convicted, with 24 prisoners released from their sentence of death.
3. California currently has the most prisoners on death row, with 731 inmates listed of prison rolls as of April 2013.
4. Even though a majority of death row inmates are white [43%], African-American inmates make up a very close second [42%].
5. The U.S. Government, including the military, have 63 people who have been sentenced to death on their detainment rosters, which is higher than the 10 states combined who have the lowest death row populations, yet still have the death penalty authorized.
6. Texas has executed the most prisoners who have been sentenced to the death penalty since 1976. At 510 executions as of this writing, that is exactly 400 more than the next state, Virginia.
7. A 2002 ruling by the Supreme Court makes it unconstitutional to sentence someone with intelligence impairments to death.
8. Since 1998, death penalty sentences have dropped by over 200 sentences per year.
9. 32 states in the United States have the death penalty.
10. Average cost of a death penalty case is $2.4 million.
Takeaway: The death penalty is becoming less utilized for a wide variety of reasons. The idea of sentencing an innocent person to die is something that makes many hesitant to assign a penalty of death. According to recent data, 88% of people don’t even think that the death penalty reduces homicide rates. This is supported by FBI data from 2011 that shows the Southern United States has the highest rates of homicide and the highest rates of death penalty assignments.
Although millions of people visit Brandon's blog each month, his path to success was not easy. Go here to read his incredible story, "From Disabled and $500k in Debt to a Pro Blogger with 5 Million Monthly Visitors." If you want to send Brandon a quick message, then visit his contact page here.