The World of Blogging
Research conducted by Technoraiti and blogpulse has revealed that blogging has increased over the years.
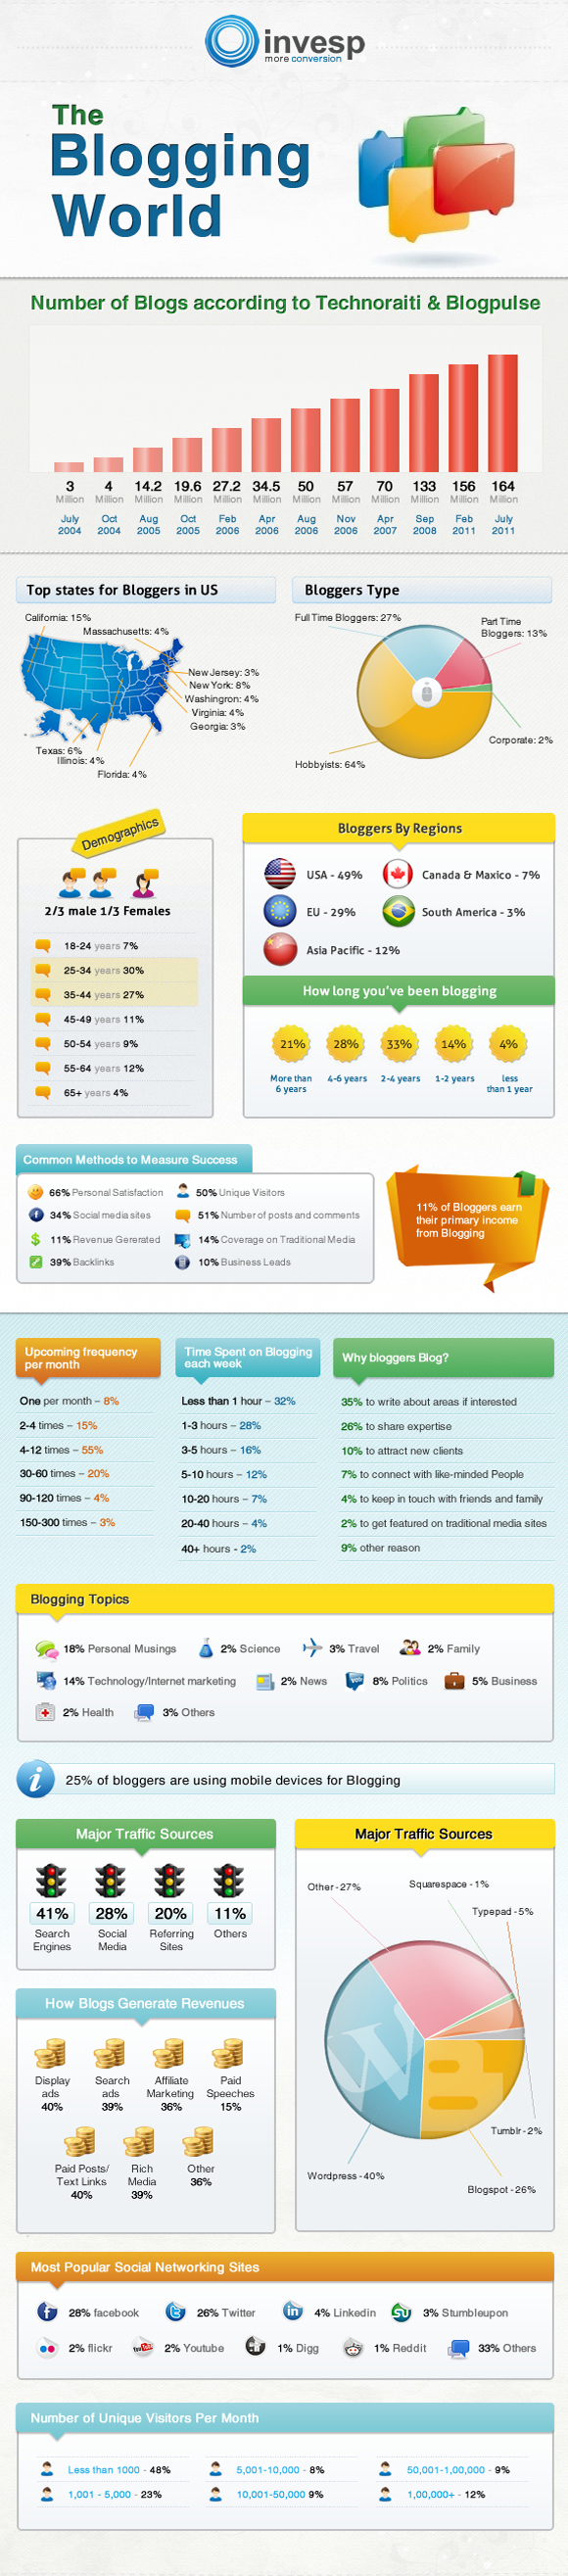
Blog Growth
July 2004 – 3 million blogs.
October 2004 – 4 million blogs.
August 2005 – 14.2 million blogs.
October 2005 – 19.6 million blogs.
February 2006 – 27.2 million blogs.
April 2006 – 34.5 million blogs.
August 2006 – 50 million blogs.
November 2006 – 57 million blogs.
April 2007 – 70 million blogs.
September 2008 – 133 million blogs.
February 2011 – 156 million blogs.
July 2011 – 164 million blogs.
Top States for Bloggers in the United States
1. California – 15%
2. Massachusetts – 4%
3. New Jersey – 3%
4. New York – 8%
5. Washington – 4%
6. Virginia – 4%
7. Georgia – 3%
8. Texas – 6%
9. Illinois – 4%
10. Florida – 4%
There are different types of bloggers, here are the different types and the percentage contribution with respect to types.
• Full time bloggers forms 27%
• Part time bloggers forms 13%
• Hobbyists bloggers forms 64%
• Corporate bloggers forms 2%
Top 5 Global Regions of Bloggers
Bloggers come from different regions around the globe, here is the list of bloggers with respect to regions around the globe.
1. USA – 49%
2. Canada and Mexico – 7%
3. European Union – 29%
4. South America – 3%
5. Asia Pacific – 12%
Different bloggers have been blogging for a reasonable length of time. Here is a breakdown of the different findings.
21% of the sampled population have been blogging for over 6 years, 28% have been into it for between 4-6 years while 33% have been involved between 2-3 years. 14% have been involved for 1-2 years while 4% have been in it for less than a year.
Demographics of Bloggers
Here is a breakdown of the demographics. Out of every three (3) bloggers, two (2) are males and one (1) is female. Here is the percentage contribution of the different age brackets.
• 18-24 years forms 7% of the sampled population
• 25-34 years forms 30% of the sampled population
• 35-44 years forms 27% of the sampled population
• 45-49 years forms 11% of the sampled population
• 50-64 years forms 8% of the sampled population
• Bloggers over 65 years forms 4% of the sampled population
Why Bloggers Blog
Success with respect to blogging is measured using different success indicators. 11% of bloggers use blogging as a primary source of income. Here are some of the methods used to measure success. 66% make use of personal satisfaction, 34% make use of social media sales, 11% consider revenue generated while 39% makes use of backlinks. 50% makes use of unique visitors, 51% consider number of posts and comments, 14% considers coverage on traditional media while 10% considers business leads as a measure of success.
Different bloggers blog at different frequencies per month, here is a breakdown of the number of times they blog in a month.
• 150-300 times per month – 3%
• 90-120 times per month – 4%
• 30-60 times per month – 20%
• 4-12 times per month – 55%
• 2-4 times per month – 15%
• Once a month – 6%
Bloggers spend different amount of times blogging per week, here is a breakdown of the different times spent by bloggers each week.
• less than 1 hour – 32%
• between 1-3 hours – 28%
• between 3-5 hours – 16%
• between 5-10 hours – 12%
• between 10-20 hours – 7%
• between 20-40 hours – 4%
• more than 40 hours on the blog – 2%
You may wonder why bloggers blog, here are the reasons why they do.
Those who write about ideas they are interested in forms 35%, 26% blog to share expertise, 10% blog to attract new customers, 7% blog to connect like-minded people. 4% do so to keep in touch with friends and family, 2% aim to get featured on traditional media sites while 9% have other reasons for blogging.
Topics Bloggers Blog About
What are the topics bloggers blog about?
16% blog about personal topics, 2% blog about science while 3% blog on travel. 2% blog on family, 14% blog on technology and internet marketing while 2% blog on news and health. 8% blog on politics, 5% on business while 3% are interested in blogging on other areas of interest. The study revealed that 25% of bloggers makes use of mobile devices for blogging.
Major Sources of Traffic
Here is a list of the major sources of traffic for bloggers.
• Search Engines – 41%
• Social Media – 28%
• Referring Sites – 20%
• Others – 11%
Other major sources of traffic are:
• Squarespaces – 1%
• Typepad – 5%
• Tumblr – 2%
• Blogspot – 26%
• WordPress – 40%
How Blogs Generate Revenue
Blogs generates revenues from different sources. 40% generate revenue from display adverts, 39% from search adverts and 36% form affiliate marketing. 15% make use of paid speeches, 40% make use of paid posts and text links, 39% make use of rich media while 36% make use of other methods.
Social networking sites popularity levels.
Facebook – 28%
Twitter – 26%
LinkedIn – 4%
Stumbleupon – 3%
Flickr – 2%
YouTube – 2%
Digg – 1%
Reddit – 1%
Other sites – 33%
Bloggers have different numbers of unique visitor per month, 18% have less than 1,000, 8% have between 5,001-10,000 while 9% have between 50,000 -100,000. 23% have 1,001-5000 unique visitors, 9% have between 10,000 – 50,000 while 12% have over 100,000 unique visitors monthly.
Although millions of people visit Brandon's blog each month, his path to success was not easy. Go here to read his incredible story, "From Disabled and $500k in Debt to a Pro Blogger with 5 Million Monthly Visitors." If you want to send Brandon a quick message, then visit his contact page here.