The global shoe (footwear) industry is a multi-billion dollar market where the United States contributes a significant amount of the revenues each year. Out of a $180 billion global market, Americans contribute over 50% to shoe producers, retailers, and distributors every year. It is part of the overall clothing and apparel industry as well, providing consumers with athletic, luxury, and sporting shoes. Sneakers are a considerably large segment of the industry as well.
Footwear, in its purest form, is a necessity for the average consumer. These products offer support and protection for the feet against the various surfaces that we all walk on each day. Although families in the past might have survived on 1-2 pairs of shoes, most people today have a collection of various shoes with different sizes, shapes, and styles that help them to meet their various needs.
Shoes are also an essential form of expression for many people around the world today. This product might protection against coarse or sharp surfaces, but they also portray a facet of their self-identity. Footwear can be a status symbol just as much as it can be a supportive product that everyone wears every day.
Essential Shoe Industry Statistics
#1. The average revenues generated by the shoe industry in the United States per person is $277.09 in 2019. That is more than $60 higher than what the industry was able to achieve in 2010. (Statista)
#2. Total revenues in the footwear market for 2019 reached $91.1 billion in the United States, which is about 30% higher than what the industry achieved in 2010. (Statista)

#3. Athletic footwear saw the largest revenue gains for the shoe industry in 2019, achieving a 95 increase over the year before. Textiles and other footwear saw a 4.6% increase, while leather shoes saw a 2.9% decrease in total revenues. (Statista)
#4. Revenues in the Chinese footwear market totaled $58.3 billion in 2018. Despite the United States leading the way in total sales, the Asian share of the global shoe industry is 54%. (Statista)
#5. The market value of the luxury footwear market in Europe is valued at nearly $18 billion. (Statista)
#6. Nike continues to lead the world in total footwear revenue, earning $22.3 billion in 2018. Adidas saw revenues reach $12.8 billion for the year. The company held a 17.9% share of the footwear market in the United States in 2016. (Statista)
#7. 96% of the shoes that are available on the secondary market, which means a consumer purchased the item from the manufacturer and is now reselling it themselves, are believed to come from Nike. (Forbes)
#8. The secondary market for sneakers and shoes is believed to be worth at least $1 billion in the United States. Manufacturers encourage this activity by producing shoes in limited numbers when there are high demand levels for the product. (Forbes)
#9. About 4% of all of the branded sneakers that become available for sale in the United States will eventually reach the secondary market. (Forbes)
#10. The average price of a pair of sneakers in the United States rose by over 5%, reaching an average cost of over $61 for the consumer. (Forbes)
#11. Balenciaga Triple S shoes are the most popular option in the luxury sneaker market, representing 52% of the sales in this industry segment for 2017. Those shoes were followed by Louis Vuitton Supreme Sports (17%), Balenciaga Speed Trainers (12%), and Adidas – Raf Simons (6%). (Statista)
#12. The three top producers of sneakers in the world today are Nike, Adidas, and Under Armour. These three companies have seen their revenues increase by more than 49% in the past 10 years. (Forbes)
#13. One series of sneakers, the Jordan line from Nike, is responsible for almost $3 billion in total revenues in the United States by itself. (Forbes)
#14. Fear of God sneakers offer the highest prices in the secondary shoe market in the world today, averaging $1,172 per pair. Balenciaga Triple S shoes sell for $1,162 in this market, while Louis Vuitton Supreme Sports can fetch over $930. (Statista)
#15. Running shoes represent 39% of the growth experienced by the U.S. shoe industry, while casual athletic shoes represent 24% of the sales. These two segments continue to lead despite declines of up to 15% in some markets. (NPD Group)
#16. Adidas saw its sales rise by almost 50% in 2017 thanks to the high popularity levels for its Superstar and Tubular Shadow lines of sneakers. (NPD Group)
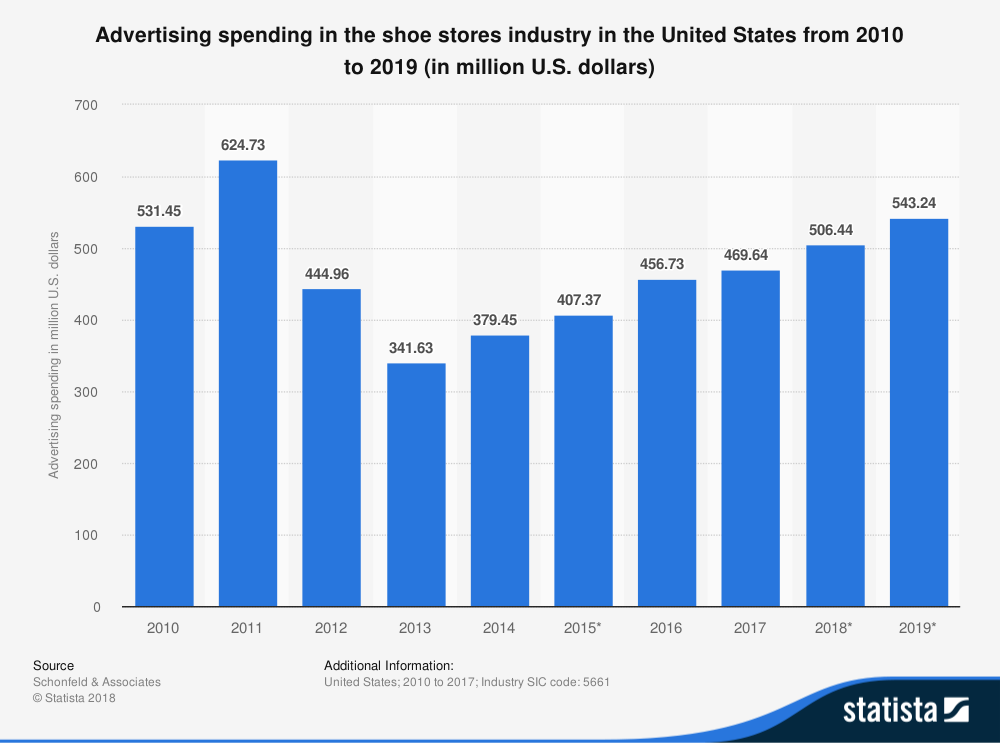
#17. Over $517 million is spent each year by footwear manufacturers on advertising that targets the American consumer. (Statista)
#18. Over 2.4 billion shoes are imported into the United States each year because the cost of manufacturing in southeast Asia helps to keep the price of each pair lower. That’s enough shoes for each American to own 7 new pairs every year. (Statista)
#19. About 16% of consumers in the United States say that they shopped for their shoes on Amazon. Online fashion sales within the footwear industry total 20.4% of the revenues earned each year. (Statista)
#20. Store-based sales for shoes in the United States accounted for $35.5 billion of the total revenues earned in 2018. Foot Locker received the lion’s share of that activity, achieving $5.57 billion in total sales. (Statista)
#21. Customers say that their need to have a new pair of shoes is the primary reason why they shop for footwear. 37% of total sales occur because consumers need to replace their current shoes for some reason. (Footwear Distributors and Retailers of America)
#22. 30% of customers in the shoe industry say that the cost of their footwear is another significant portion of their shopping decisions and habits. (Footwear Distributors and Retailers of America)
#23. 60% of the shoes that are on the secondary market right now belong to the Nike brand, with many of them rated as the most valuable shoes of their category. The Back to the Future specialty sneakers are valued at more than $6,000 if they are unworn. You could also pick up a pair of Air Jordan 10 Retro Drave OVOs for about $4,000. (Campless)
#24. California is the home to the secondary market for shoes, especially if you are looking for a rare pair of sneakers. Over $15 million in sales occur in the state each year. Another $12 million comes from New York, while Florida offers $7.5 million in revenues. New Jersy and Texas both contribute more than $4 million annually. (High Snobiety)
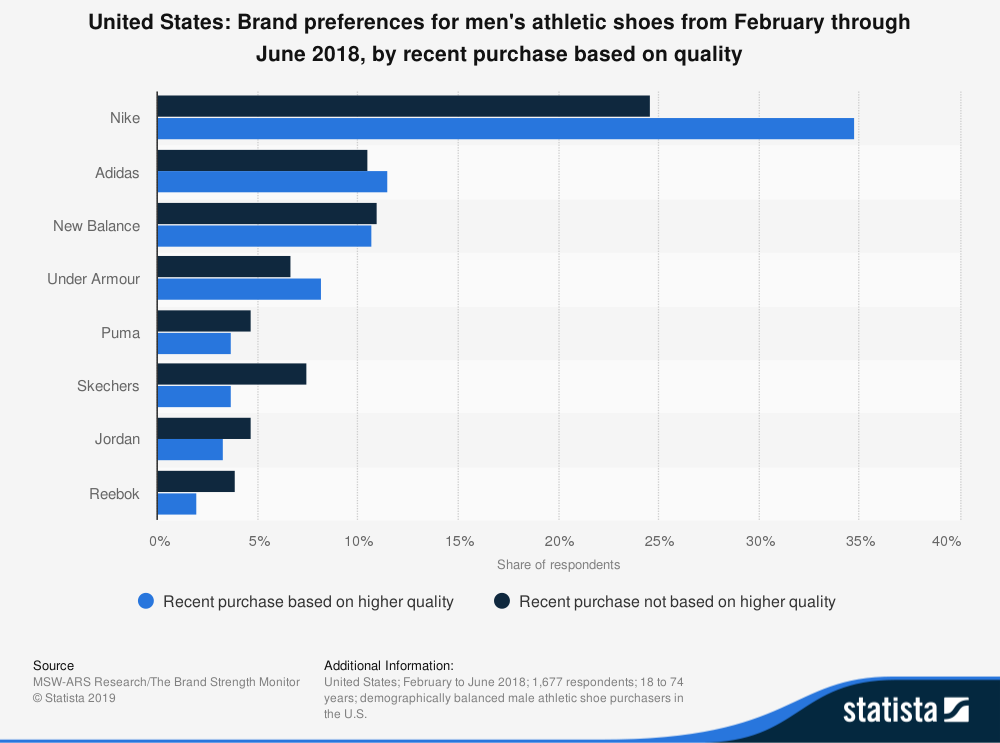
#25. 47% of shoe customers say that they’ve purchased at least one pair from the Nike brand within the past two years. That’s almost double what Adidas, who finished in second, had in the survey, with 24% of customers saying that they had purchased at least one pair. (Statista)
#26. 1 out of every 5 shoe customers say that they have purchased a pair of New Balance shoes and something from the Skechers brand in the past 24 months. (Statista)
#27. Over 150 million pairs of sneakers are imported by the United States each year from Vietnam, which represents about one-third of the overall shoe market for Americans each year. (PBS)
#28. Only 1% of the sneakers that consumers in the United States purchase each year were manufactured domestically. (PBS)
#29. China exports over 230 million pairs of shoes to be purchased by the American consumer every year, representing 50% of the overall U.S. industry inventory. (PBS)
#30. When customers want to purchase basketball shoes, they turn to Nike. The Jordan brand represents about 90% of the sales that occur in the segment each year. (PBS)
#31. Nike dominates search engine research queries from customers who are looking for new shoes online. About 1 in every 10 Google searches are for a shoe made by this brand. Adidas as a brand receives about the same number of unique searches (5.88%) as the Air Jordans do for Nike. (Sneakers Magazine)
#32. New Balance introduced their 99X series of running shoe in the 1980s, disrupting the industry because of its unique comfort profile and options for customization. This brand represents about 10% of the revenues that the industry earns every year. (Sports Business Daily)
#33. Nike lost 3.7% of its market share in 2017, which was the first time such an event had happened since 2002. They saw a 14% drop in their earnings in the sneaker segment, despite seeing a 55% increase in brand share and a 40% market share in that category. (Sports Business Daily)
#34. About 217,000 people are currently working in the shoe industry in the United States, which is the most since 1990 even when you take seasonal adjustments from those numbers. Employment opportunities at domestic shoe stores rose by 1.8% in 2017. (Footwear Distributors and Retailers of America)
#35. Despite the higher employment numbers, the sales per employee at U.S. domestic shoe stores plummeted to its lowest level since 2011 at less than $13,000 per person. (Footwear Distributors and Retailers of America)
#36. 52% of shoe industry customers say that they plan to spend less on shoes in the coming year compared to what they spent in the previous year. About 14% of consumers said that their intention was to spend more on their footwear needs. (Footwear Distributors and Retailers of America)
#37. 21% of consumers say that they shop online for their footwear needs instead of at a shoe store because the price they found either met or exceeded their expectations. 18% of industry customers shopped online because they liked to see the inventory variety that was available compared to what they could find locally. (Footwear Distributors and Retailers of America)
#38. Only 12% of consumers say that they regularly shop for shoes online because it is convenient for them to do so. (Footwear Distributors and Retailers of America)
#39. Although Americans contribute more revenues to the shoe industry than any other country, over half of the world’s footwear is consumed in Asia. Europe comes in second with 16% of total consumption, followed by North America at 15%. (Statista)
#40. China produces about 13.5 billion pairs of shoes every year, which leads the world in total footwear production. When you include APAC neighbors Vietnam, India, and Indonesia, these four countries were responsible for 75% of the shoes that were made in the world in 2017. (Statista)
#41. China also leads the world as the largest consumer of footwear, with over 2.3 billion pairs of shoes purchased in 2017. When you look at the top 5 countries in terms of shoe consumption for the industry, they mirror the most populated countries in the world exactly. (Statista)
#42. Before going out of business, Payless was ranked the 17th-largest provider of footwear dollar sales in the United States. That represented about 2% of the overall market volume. In terms of unit sales, the company accounted for 4% of all pairs sold in the U.S. in 2018. Almost 50% of the customers who purchased something from this company also bought a pair of shoes from Walmart. (NPD Group)
#43. Men’s footwear rose 50% with $27.3 billion in total sales for 2017, while women’s footwear grew by 35% and kid’s shows rose by 15% to help the market. Millennials helped to fuel this search, as the average spending per buyer from this generation is $308. (UBM Fashion)
#44. When shoe industry customers were asked if they made a purchase because of the social mission of a brand, 27% of respondents in a 2018 survey said that they did. That figure was even higher for Millennials, at nearly 40%. (UBM Fashion)
#45. Two significant segments of the shoe industry which are seeing growth rates of 30% or more each year are off-season footwear and festival-driven shoes. (UBM Fashion)
Shoe Industry Trends and Analysis
Shoes will always be a necessity at some level. We use them to play sports, take walks, and protect our feet while looking for ways to turn the footwear into a fashion statement. It is a product that provides comfort for people of all ages, races, gender identities, and ethnicities, which means it is one of the few products that brings us together.
As the cost of manufacturing continues to rise in southeast Asia due to changes in local minimum wage laws, revenues for the shoe industry will continue to rise to meet the expectations of rising costs. Expect total sales in the United States to reach as high as $110 billion through 2029, with a global market value approaching $250 million when all footwear categories are combined.
Luxury shoes will continue to dominate in the per-item revenue category, with even significant brands like Nike and Under Armour getting into that segment.
Shoes help each person to say something about their unique style and approach to life. As the industry continues to revolutionize is comfort and looks, consumers will keep flocking to the latest products to make their own statement in life.
Although millions of people visit Brandon's blog each month, his path to success was not easy. Go here to read his incredible story, "From Disabled and $500k in Debt to a Pro Blogger with 5 Million Monthly Visitors." If you want to send Brandon a quick message, then visit his contact page here. Brandon is currently the CEO of Aided.