The seafood industry provides one of the highest traded food commodities in the world today. Out of the 170 million tons of fish that are produced by the industry each year, about 136 million tons are used for food products. The average person in the world today eats more than 40 pounds of seafood products each year.
There is a severe problem that faces the industry right now which impacts its profitability. Over 90% of stocks are either fully exploited or over-exploited, which limits the number of static fishery landings which are available. Only 71% of the commercially important marine fish stocks which are monitored by the United States are fished at levels which are biologically sustainable.
That is why the industry is turning to aquaculture as a way to continue providing a needed food supply. By 2030, over 60% of the seafood products which hit grocery store and supermarket shelves are expected to come from aquaculture production.
Important Seafood Industry Statistics
#1. Aquaculture continues to play an increasing role in supplying the world with seafood products, accounting for 4.5% of the 2017 harvest. Over 83 million tons of seafood were provided by these farms. (FAO)
#2. Total global fish production, in combination with improving economic conditions globally, contributed a 2.3% increase of available seafood supplies in 2017. (FAO)
#3. The total value of the global seafood market was an estimated $120.8 billion in 2016. By 2023, the industry is estimated to be worth more than $150 billion. (Statista)
#4. Marine Harvest, one of the largest salmon farming producers in the world today, generated average shareholder returns of 47% during the 5-year period ending in 2016. The agricultural sector provided 7% returns, while the protein sector provided 17% returns respectively. (Financial Times)
#5. The amount of seafood which people eat each year continues to rise. In 1960, the global per capita of consumption was just 20 pounds, compared to the 40 pounds which people eat today. (NCRAC)
#6. Fish products comprise 17% of the global population’s consumption of animal protein. (NCRAC)
#7. Up to 12% of the global population depends on aquaculture or fisheries for their livelihood. 84% of the people in this situation are living in the Asia-Pacific region. (NCRAC)
#8. There are currently 4.7 million fishing vessels that are operating on behalf of the global seafood industry at some point throughout the year. (NCRAC)
#9. China is the top producer of seafood products in the world, contributing 17% of the total supply. Peru comes in second at 8%, followed by Indonesia (6%), the United States (5%0, India (5%), and Japan (4%). (NCRAC)
#10. Freshwater fish make up 10% of the annual harvest each year, which is the largest captured species group. Tuna and bonitos make up 7% of the harvest, while cuttlefish, octopuses, and squids make up 4% of it. (NCRAC)
#11. 62% of the aquaculture activities supported by the global seafood industry are based in China. The next closest producer is India, which holds a 7% share of the market. (NCRAC)
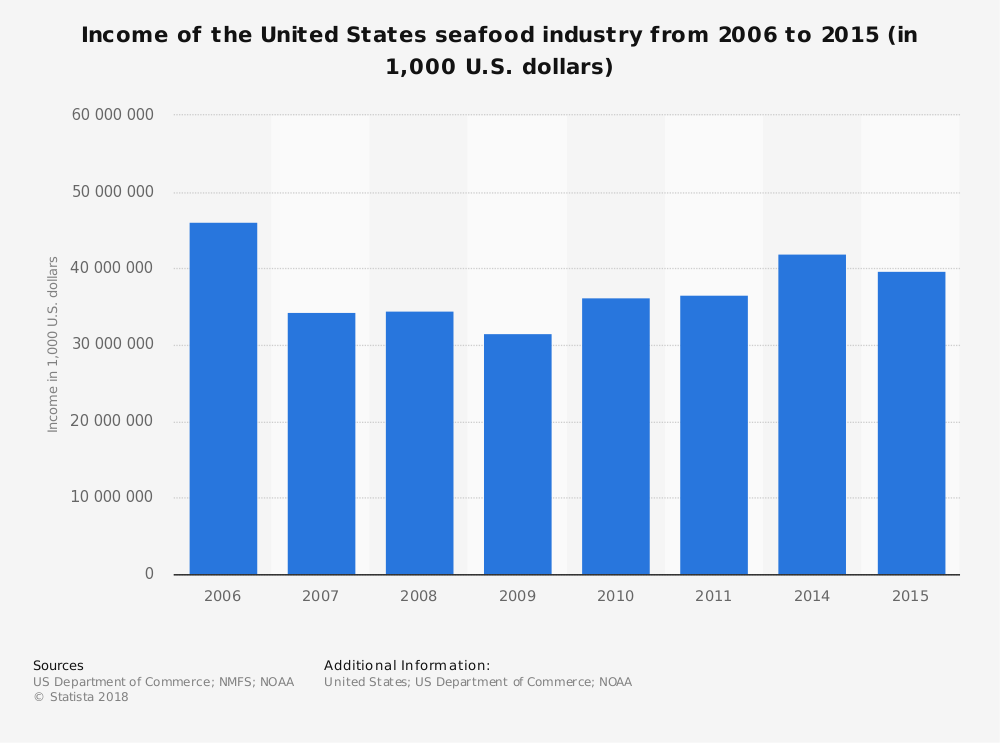
#12. The value of commercial landings of shellfish and fish in the U.S. is valued at $5.4 billion per year, with most of the products made available to human food supply chains. (Statista)
#13. Edible fishery products in the United States hold a value of $8.76 million. (Statista)
#14. 27% of Americans say that they purchase fish or seafood products at least once per week. 25% of consumers who go to a restaurant say that they’ve already decided to eat seafood before they’ve arrived at their destination. (Statista)
#15. 56.4 million pounds of Atlantic squid were landed by U.S. commercial fisheries in 2016 (the last year statistics have been made available). That was a 176% increase from the landings achieved in 2015. (NOAA)
#16. 64.2 million pounds of Dungeness crab were harvested by seafood industry in the U.S. in 2016, which was a 168% increase from the year before. (NOAA)
#17. Commercial anglers landed 558 million pounds of Pacific hake in 2016. The Pacific region of the United States is responsive for 10% of the total landings which occur and 13% of the industry’s value. (NOAA)
#18. Alaska is the national leader for the U.S. within the seafood industry. 58% of the landings which occur take place in the waters around the state. Only 29% of the value, however, is generated by their efforts. (NOAA)
#19. Dutch Harbor, AK is the largest port by volume, processing 770 million pounds of seafood in 2016. It has been the highest-volume port in the United States for 20 consecutive years. (NOAA)
#20. New Bedford, MA is the highest-value port in the United States, a title it has held for 17 consecutive years. Over $327 million in seafood products come through the port each year. (NOAA)
#21. 75% of the seafood that is processed by the U.S. commercial fisheries and seafood industry is used as fresh or frozen food for humans. Another 19% is used for either fish meal or oil products. Only 3% is used for animal food, while 2% is canned for human food products. (U.S. Department of Agriculture)
#22. Less than 1% of the seafood products which are sold to consumers is cured to provide food products for humans. Despite this fact, 11% of the sales of edible seafood products are in canned goods, providing a $1 billion boos to the U.S. economy. (NOAA)
#23. Frozen foods make up 64% of the U.S. seafood industry, providing $6.09 billion worth of value each year. Fresh edible products provide another $1.53 billion in revenues. (NOAA)
#24. 30% of the seafood which is processed by volume in the United States is from one species: Alaska Pollock. It is also responsible for 21% of the revenues generated by the industry each year. (NOAA)
#25. 50% of the edible imports that come to the United States originate from East Asia. About 3 billion pounds of seafood is imported each year with a value of $9.6 billion. In comparison, the U.S. exports about 1.6 billion pounds of edible seafood products with a value of $2.65 billion. (U.S. Department of Commerce)
#26. 60% of the exports the U.S. sells are whole fresh or frozen finfish. 21% of the imports are for surimi, while caviar and roe make up 4% of the total volume. (U.S. Department of Commerce)
#27. The U.S. spends over $4.4 billion per year on fresh and frozen shrimp imports. Another 29% of our imports, totaling $2.18 billion, are for fresh and frozen fillets. (U.S. Department of Commerce)
#28. With over 620 million pounds of seafood produced by aquaculture, the United States ranks 16th in the world for farmed fish. Salmon is the most common farmed food, with 48 million pounds produced. Oysters (35 million pounds) and clams (9 million pounds) make up the bulk of the remaining species which are farmed. (NOAA)
#29. Since 2010, U.S.-based aquaculture has grown by just 1% per year. (NOAA)
#30. Japan is home to a $14 billion commercial fishing industry. About 200,000 fishing vessels serve at any given time, with about 2,000 vessels searching for bonito and tuna. (National Geographic)
#31. Japan harvests 7.5 million metric tons of seafood each year with their fishing industry, making them the world leader. China harvests 7 million metric tons, while Peru harvests 6.7 million tons. (National Geographic)
#32. 48% of the shore fish stocks which are caught off Japan have declined since 2007. Several fishing villages have lost a majority of their residents because there is no longer work available for them. (National Geographic)
#33. Japan is the most diversified seafood marketplace in the world today, with food products provided by over 120 different countries. China is the top supplier of edible products with 17.9% of the market, followed by Chile (8.2%), Thailand (8.1%), Russia (7.8%), and the United States (7.8%). (Agriculture and Agri-Food Canada)
#34. Canada is the 12th-largest supplier of fish and seafood products to Japan, creating an economic boost of C$427.5 million per year. (Agriculture and Agri-Food Canada)
#35. The per capita consumption of fish and seafood products in Japan has declined from 40kg to 33kg because of a related increased to the consumption of dairy and meat products in the country. (Agriculture and Agri-Food Canada)
#36. 97% of the households in the United Kingdom have purchased seafood at least once in the past year. Revenues generated by the seafood industry topped GBP 6.61 billion in 2017, which was an increase of 4.7% from the year before. (Seafish)
#37. There were 13,500 full-time jobs, encompassing over 300 firms, actively supporting the UK seafood industry in 2016. About 60% of the total industry employment is located in Humberside and the Grampain region of Scotland. (Seafish)
#38. There were more than 6,300 registered fishing vessels in 2016 for the seafood industry in the UK, which is a 7% reduction compared to 2006 figures. Over 1,700 of those vessels are classified as being inactive, with another 1,700 listed as being “low activity’ vessels producing less than GBP 10,000 per year. (Seafish)
#39. About 12,000 commercial anglers are employed by the UK seafood industry, a figure that is down 9% from 2006 employment numbers. 1 in 5 workers is only employed part-time. (Seafish)
#40. About 701,000 tons of seafood were landed in the United Kingdom in 2016, with a final value of GBP 936 million. That represents a 1% decrease in volume, but a 21% increase in value for the industry compared to the year before. Live weight value per vessel averages GBP 2,200 per ton. (Seafish)
#41. 64% of the fish caught by fleets stationed in the United Kingdom were landed within its borders. These landings represented 74% of the fishing income for vessels, while the local fleet was responsible for 89% of all fish landed. (Seafish)
#42. Pelagic species are caught most often in the UK, accounting for 53% of the total landings, but represented just 28% of the total revenues earned by the industry. (Seafish)
Seafood Industry Trends and Analysis
With commercial fisheries being aggressively managed to offset the prior mismanagement of the biomass, the global seafood industry is turning toward the idea of aquaculture in greater numbers. Over the next 10-year period, the aquaculture segment is expected to grow at a rate of 5% annually as more investors explore how farmed fish can help to repopulate the worlds rivers, lakes, and oceans.
To keep prices down, the seafood industry must invest in proactive care options for the species they manage. Growth in aquaculture is currently limited by severe disease and pest outbreaks. Salmon prices reached record highs because of issues with algae blooms and sea lice in 2016. There are environmental impacts to fish farming which must be considered as well, since many species are not raised in natural conditions.
As income levels continue to rise around the world, especially in China and India, the desire for more animal protein will create more pressure on the seafood industry to produce. Without aquaculture breakthroughs, the volume of food available will decrease, but the industry will continue to see their profits rise.
Although millions of people visit Brandon's blog each month, his path to success was not easy. Go here to read his incredible story, "From Disabled and $500k in Debt to a Pro Blogger with 5 Million Monthly Visitors." If you want to send Brandon a quick message, then visit his contact page here. Brandon is currently the CEO of Aided.