#1. The candy industry generates around $35 billion in revenues at the retail level each year in the United States. (National Confectioners Association)
#2. Hershey’s currently holds a 43.8% market share on chocolate products sold at the retail level in the United States. Hersey also hold a leading share of the overall candy market in the U.S, responsible for 30% of total sales. (Statista)
#3. Mars is the leading global confectionery company. They currently hold a 28.9% share of the U.S. confectionery market. (Statista)
#4. Sales of M&M’s in the United States totaled $688.7 million in 2016. (Statista)
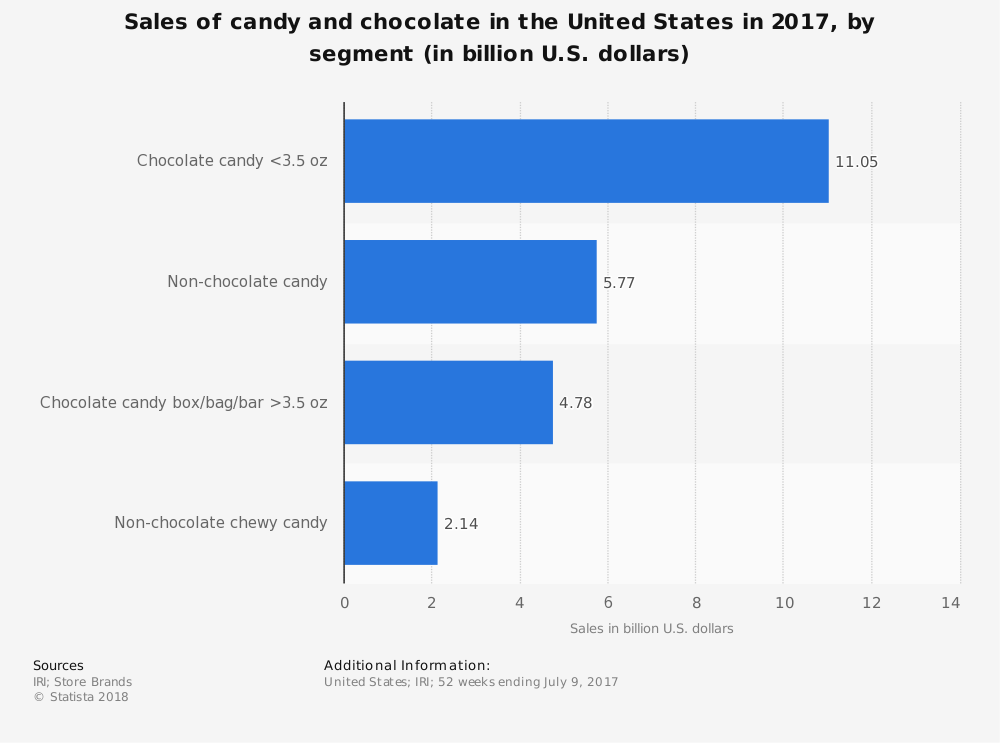
#5. The sale of retail chocolate in the United States from countlines totaled $6.39 billion in 2016. (Statista)
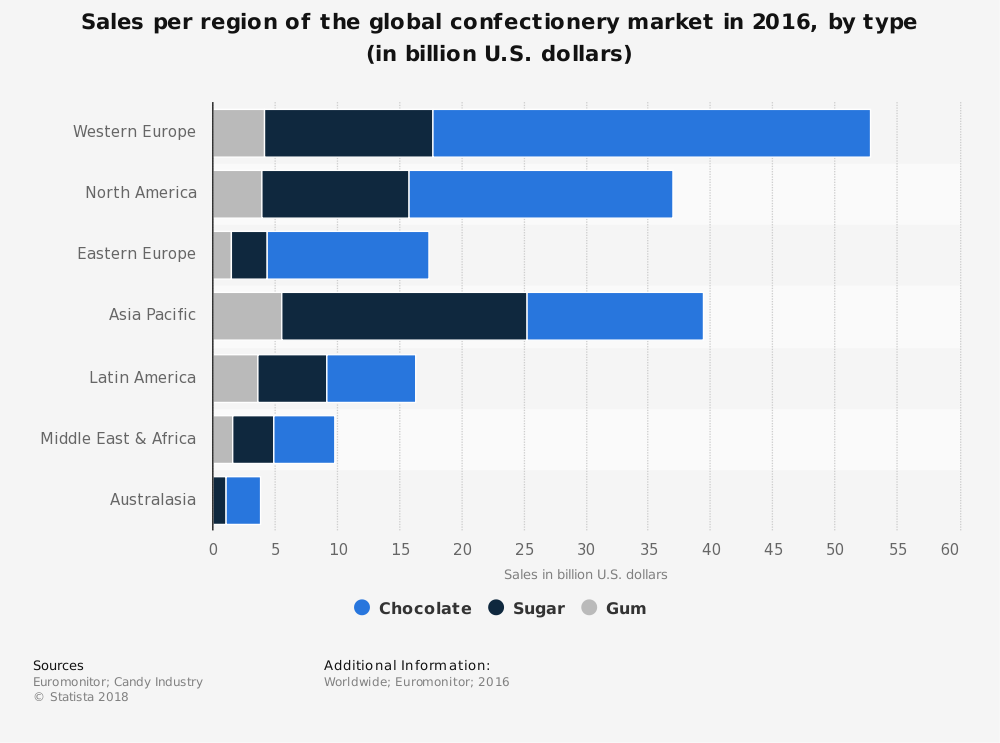
#6. Gum sales in Asia totaled $5.49 billion. (Statista)
#7. Wrigley’s Extra is the leading brand of sugarless gum in the United States. Their Double Mint brand generate $108.9 million in sales in 2016. (Statista)
#8. The retail sales of chewing gum in India totaled $600 million in 2016. (Statista)
#9. In 2016, the global retail consumption of chocolate products within the candy industry reached 7.7 million metric tons. Switzerland was the largest consumer of chocolate products in the world today. (Statista)
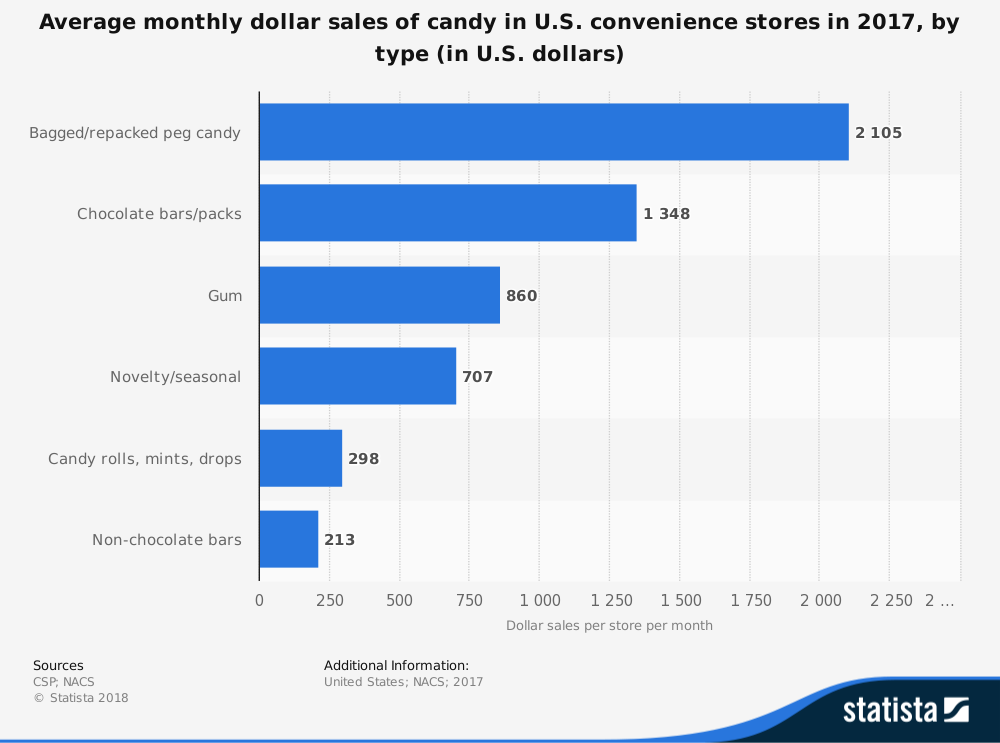
#10. About 20% of Americans say that they purchase candy that is seasonal. (Statista)
#11. Candy sales in Western Europe totaled more than $52.8 billion in 2016. (Statista)
#12. The global retail sales of candy products reached $186 billion in 2017, which reflects a 2.7% increase from the year before. (Euromonitor)
#13. Chocolate continues to be a global leader in overall sales, seeing a 3.3% rise in values. Sugar-based confectionery sales rose by 2.4%, while gum sales rose by 0.9%. (Euromonitor)
#14. Three products (Sour Patch Kids, Starburst, and Haribo Gold Bears) helped non-chocolate dollar sales to grow by 4.5% in the first half of 2018, while chocolate sales grew at just 2.5% over the same period. (Euromonitor)
#15. Mondelez saw a 13% drop in revenues in 2016, without a return to growth until Q3 2017. Part of the issue was a $140 million loss due to a malware attack at the organization. (Euromonitor)
#16. An estimated 13,600 businesses are currently active within the global candy and chocolate manufacturing industry today. These firms are responsible for the direct employment of over 450,000 people. (IBIS World)
#17. From 2012-2017, the candy industry saw average annual growth rates of 0.9%, reaching a total valuation of $143 billion. (IBIS World)
#18. In the United States, the candy production segment of the industry has experienced a slight decline since 2012. From 2012-2017, the industry saw a decrease of 0.3% on average each year. (IBIS World)
#19. About 500 businesses are currently involved with candy production in the United States, providing direct employment opportunities for about 17,000 people. (IBIS World)
#20. Total revenues generated by the candy production segment of the U.S.-based industry are valued at $8 billion. (IBIS World)
#21. The U.S. West is the most popular geographic region to product candy, responsible for over 18% of the total active locations in the United States. On its own, California is responsible for over 10% of all establishments. (IBIS World)
#22. People are beginning to pay attention to the ingredients that are found in their candy as well. 45% of global consumers said they would prefer a product which contained natural ingredients. This was followed by a preference for no artificial colors (44%), no GMOs (43%), and no artificial flavors (42%). (Nielsen)
#23. The fat-free segment of the candy industry brought in $882 million of revenues, according to 2014 figures that were released. Reduced-fat candies brought in another $456 million in revenues, while low-fat candies brought in $240 million. (Nielsen)
#24. The no-sugar segment of the candy industry saw the strongest levels of growth between 2011-2014, tripling in total value. It is a segment that is now worth $3 million. (Nielsen)
#25. Reduced calorie, low calorie and calorie-free candies have also seen strong revenue growth, reaching a total value of $436 million for the global industry. (Nielsen)
#26. Since 2011, GMO-free candies have doubled in sales, going from $29 million in revenues to $72 million in 2014. (Nielsen)
#27. Organic candies provide a $61 million boost to global revenue figures for the candy industry. (Nielsen)
#28. In 2017, Mars Wrigley Confectionery generated net sales of $18 billion, making it the top global candy producer in this category. They were followed by the Ferrero Group ($12 billion), Mondelez International ($11.5 billion), Meiji Co Ltd of Japan ($9.6 billion), and Nestle ($8.8 billion). (International Cocoa Organization)
#29. Organic cocoa is a small, growing segment within the candy industry. In 2017, it was less than 0.5% of the overall cocoa market. About 15,500 tons were produced for the global candy industry, with Madagascar being a leading exporter. (International Cocoa Organization)
#30. Global organic chocolate sales increased in value from $171 million in 2002 to $304 million in 2005, driven upward because of ongoing concerns regarding food safety. (International Cocoa Organization)
#31. Certified organic cocoa products are able to sell at a higher volume, reaching rates of $300 per ton. Originating countries with small volumes of organic cocoa can fetch a premium of 3 times the going rate, with some pricing near $1,000 per ton in 2017. (International Cocoa Organization)
#32. From 2007 to 2014, the price index for chewing gum and candies rose 23%. From 1997 to 2006, the price index rose just 13%. In the U.S., the price index has remained relatively stable since 2011. (Bureau of Labor Statistics)
#33. Since December 2007, the CPI for fresh cupcakes produced by members of the candy industry has risen by 21%. (Bureau of Labor Statistics)
#34. Brown County, Indiana has the highest location quotient for candy manufacturing in the United States, at 15.8 positions per 1,000. (Bureau of Labor Statistics)
#35. Total cocoa production worldwide reached 4.55 million tons in 2016, with about 70% of that production located in Africa. (Statista)
#36. Almost 2 million tons of cocoa that is available to the global candy industry originates from the Ivory Coast. Almost 540,000 tons of cocoa beans are processed in the country every year. (Statista)
#37. Sales of Reese’s snack-size chocolate candy in the United States totaled $171.6 million in 2016. (Statista)
#38. About 80% of adults in the United States say that they eat chocolate candies on a regular basis. (Packaged Facts)
#39. Premium chocolates control an 18% market share of total dollar sales for the chocolate segment of the candy industry in the United States. (Packaged Facts)
#40. The top 4 marketers of seasonal chocolate candies manufactured for Halloween are responsible for nearly 98% of the dollar sales experienced by the segment. Just two companies generated 70% of all chocolate candy sales at the retail level. (Packaged Facts)
#41. 48% of U.S. consumers say that they’ve purchased a dark chocolate candy product within the last year. 30% of these consumers purchased their chocolate online. (Packaged Facts)
#42. The sales of sugar-free chocolate candies from Russell Stover totaled $83.2 million in 2016. (Statista)
Candy Industry Trends and Analysis
The United States continues to be a global leader in the consumption of candy products. It is an almost recession-proof industry, as many households in the U.S. view candy as an affordable treat, even when money is short for them.
As income levels rise around the world, especially in countries like India with a large middle class, the candy industry has some explosive growth opportunities to consider. The industry will benefit from the demand from emerging markets, in addition to demand in mature markets for innovative new products that can satisfy a sweet tooth.
Industry forecasts place CAGR growth between 3.1% to 5.4%, depending upon the company providing the evaluation of trends and analysis. Although this growth is certainly possible, the previous 5-year trend did not reach its forecast goals. Nothing suggests that anything will dramatically change through 2023 or 2028 for the industry, which means a more accurate CAGR forecast would be in the 1% to 2% range.
Although millions of people visit Brandon's blog each month, his path to success was not easy. Go here to read his incredible story, "From Disabled and $500k in Debt to a Pro Blogger with 5 Million Monthly Visitors." If you want to send Brandon a quick message, then visit his contact page here. Brandon is currently the CEO of Aided.