How do you work on infographics right now? You would have a subject matter to talk about. You will break down that subject matter to a few interesting facts. You will choose the most important or interesting facts. They could be surprising or shocking, enlightening or obvious. You would find short illustrations of those facts to make them easy for everyone to understand. Once you have the content, you would work on the design of the infographics. You would pick a layout, choose a few colors, different fonts and you would set it up. Once created, you may be tempted to create an alternative if you wish to run an AB test.
There are two ways of creating infographics. One is where you have complete freedom and you can be as creative as you want. The above approach will be ideal to enjoy absolute freedom. The other approach is to be scientific. Infographics have been around for a long enough time for trends to emerge. From the success and failure of thousands of infographics, one can understand the technicalities of what works and what doesn’t.
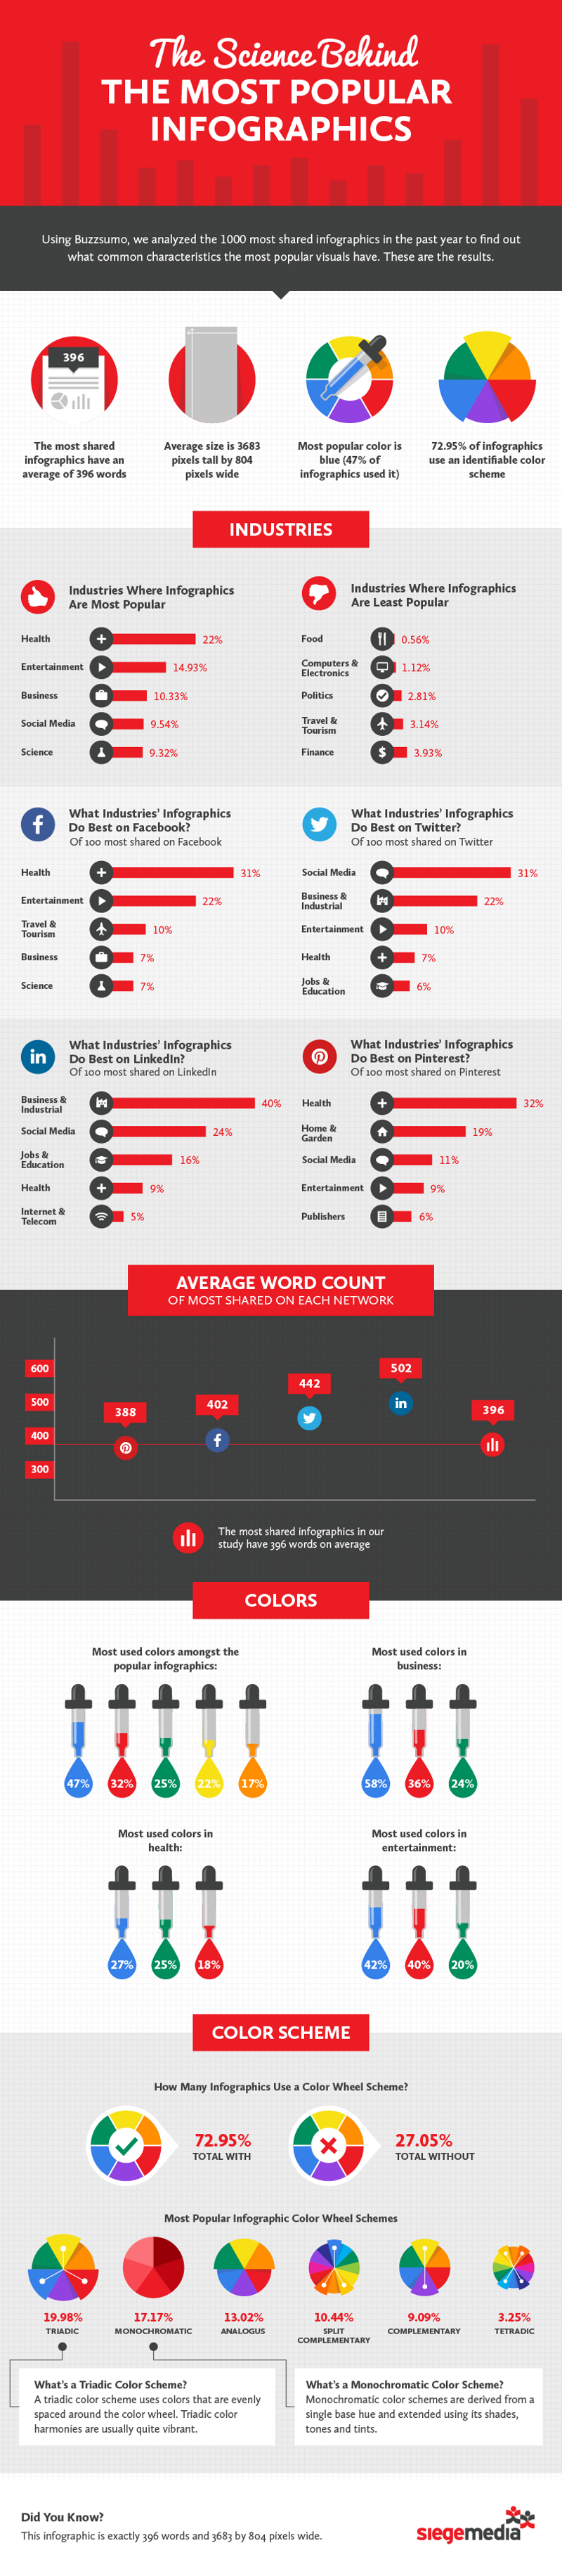
1) Let us begin with the industries that benefit most with infographics.
Health, entertainment, business, social media, science, travel and tourism are the industries that benefit most. Food, consumer electronics including computers, finance and politics don’t really benefit from infographics. You also need to choose the right mediums for the kind of infographics you have. For instance, Facebook is ideal for health and entertainment. Twitter is ideal for social media and business or industrial infographics. LinkedIn is ideal for business, industries, jobs and education. Pinterest is ideal for health, home and garden.
2) Now, let us talk about the size.
There are two elements here. One is the word count and the other is the spatial size of the infographic. Most infographics have a word count of more than three hundred up to five hundred. The average word count of the successful infographics is around four hundred. The average size of effective infographics is about 804 pixels wide and 3683 pixels long.
3) Colors play a vital role in infographics.
No one likes black fonts on white backgrounds any more. The most popular colors for infographics are blue, red, green, yellow and orange. Blue, red and green remain the most widely used colors by businesses, in health and in entertainment.
Fonts don’t really have trends per se because as long as the words or numbers, symbols or images are coherent with the infographic, they are effective.
Although millions of people visit Brandon's blog each month, his path to success was not easy. Go here to read his incredible story, "From Disabled and $500k in Debt to a Pro Blogger with 5 Million Monthly Visitors." If you want to send Brandon a quick message, then visit his contact page here. Brandon is currently the CEO of Aided.