Our fossil fuel consumption in the world today began about 6,000 years ago. Ancient Chinese civilizations began to use black lignite as a source of combustion for heating. They would also use the materials for carving. This exposure would be our first opportunity to see what the power of coal could have on our world.
Since the beginning of the 1800s, the global consumption of fossil fuels has continued rising. From the first moments that we began to industrialize, our energy consumption has risen over 1300-fold. Although we now have a larger diversification of fossil fuel energy consumption, the number of terawatt hours that we gain from this resource continues to rise.
Coal was responsible for 96% of fossil fuel consumption in 1900. It was responsible for less than 30% in 2000. Crude oil is now the largest energy source for the fossil fuel industry, accounting for roughly 39% of what we use on a global scale.
Despite all of the positive gains that the developed world has seen over the centuries because of this resource, there are negative impacts to consider as well. Fossil fuels are the dominant source of local air pollution, and the carbon dioxide they emit may contribute to the world’s warming trend.
Important Fossil Fuel Industry Statistics
#1. The United States counts for 10% of the total coal production that happens in the world today. (Statista)
#2. Refineries in the United States will produce roughly 23.4 quadrillion BTUs of crude oil by 2015. This fossil fuel is used to create liquid products like diesel, gasoline, and heating oil. (Statista)
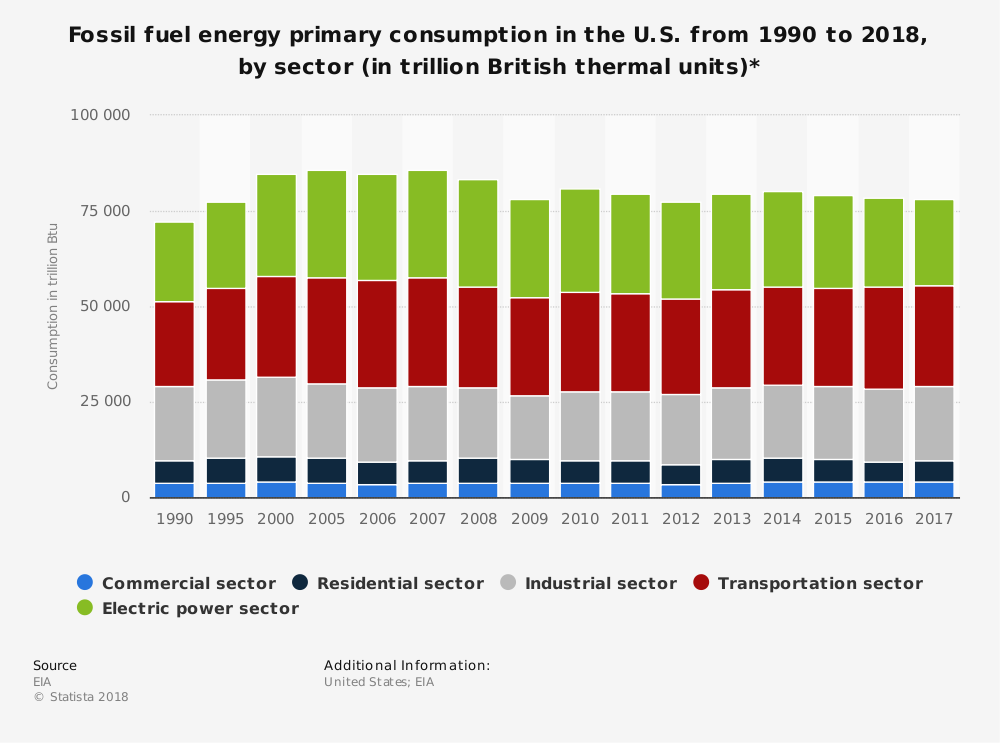
#3. The fossil fuel industry is responsible for generating about 82% of the electricity we consume in the world today when it is combined with our nuclear resources. (Statista)
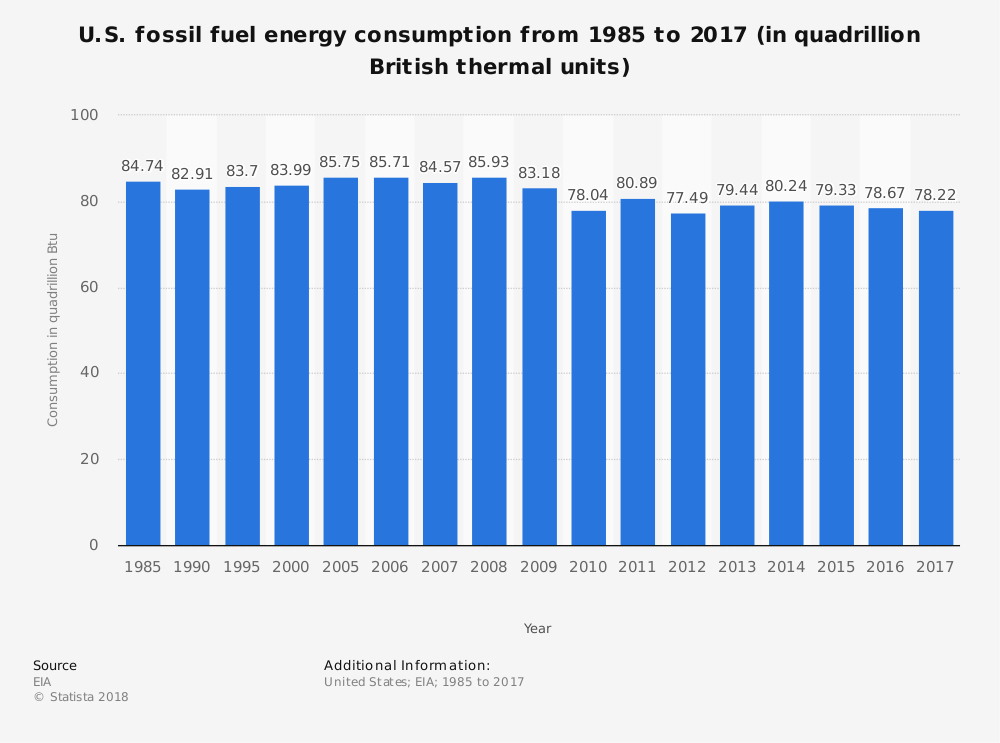
#4. The renewable share of the energy consumption in the United States reached its largest percentage since the 1930s by achieving a market share of 10% in 2015. That means fossil fuels are still responsible for 81.5% of the energy we consume annually. (Energy Information Administration)
#5. Coal consumption in the United States has been falling consistently for the past 20 years. In 2015, the rate of use for this fossil fuel was 13% lower than the year before. That was the steepest annual percentage decrease seen for the fossil fuel industry in the last 50 years. (Energy Information Administration)
#6. Natural gas is the most significant fossil fuel resource that is used in the United States. 41% of the market share for the industry went to this resource in 2017. Crude oil was in second with a 29% market share, while coal provided 23% of the industry. HGL was responsible for the remaining 7%. (Energy Information Administration)
#7. Consumers in the United States go through 913.3 million metric tons of crude oil every year. They also use 332.1 million metric tons of coal for their energy needs. (Statista)
#8. Natural gas consumption in the United States reaches 27.1 trillion cubic foot annually. (Statista)
#9. The United States is on the verge of surpassing crude oil consumption levels that average 20,000 barrels per day. Americans consumed 19,877 barrels of crude oil per day in 2017. (Statista)
#10. For every dollar that the oil and gas industry spends on campaign contributions for politicians in the United States, they receive $119 back in subsidies each year. Over $350 million been spending happened during the 113th Congress. (Oil Change International)
#11. Global natural gas production rose by 3.6% in 2017, giving the industry its largest increase since 2010. This segment has been rising ever sense the economic crisis of 2009, showing a compound annual rate of growth at 2.6%. (International Energy Agency)
#12. Australia has nearly tripled its production of natural gas since 2004, becoming the eighth-largest producer in the segment for the 2017 production year. (International Energy Agency)
#13. The worldwide demand for natural gas resources increased by 3.2% in 2017, rise into a total of 3.75 billion cubic meters. Consumption levels for this fossil fuel have risen by an average of 6.3% since 1990. China has seen growth rates even higher over the same period, averaging 13.1%. (International Energy Agency)
#14. The United States imported over 10 million barrels of petroleum per day from roughly 84 countries in 2017. 79% of these gross imports were for crude oil, with the remainder classified as a non-crude oil product. (Energy Information Administration)
#15. Over 40% of the gross imports of petroleum products to the United States came from Canada. Saudi Arabia came in second with a 9% share, followed by Mexico and third at 7%, Venezuela at 7%, and then Iraq at 6%. (Energy Information Administration)
#16. Mexico was the top destination for petroleum exports from the United States in 2017. Over 1.08 million barrels per day were sent south of the border, accounting for a 17% market share. Canada followed in second with a 14% market share, followed by China in third at 7%. Brazil imported 400,000 barrels per day for a 6% share, while Japan imported 350,000 barrels per day for a 5% share. (Energy Information Administration)
#17. Since 1998, almost 75% of human-caused greenhouse gas emissions have come from the burning of fossil fuels. (U.S. Department of Energy)
#18. Over 2 million people are currently employed in the United States because of the fossil fuel industry. A significant majority of those positions are located in fueling stations and convenience stores. (Bureau of Labor Statistics)
#19. Solid fossil fuels such as coal provide roughly 1/7 of the production of primary energy for the European Union according to 2016 figures. (Eurostat)
#20. 14% of the production of primary energy in the European Union in 2016 came from natural gas. Another 10% of this resource was accounted for by crude oil during the year. (Eurostat)
#21. 56% of the jobs found in the energy industries of the United States involve creating power from coal, natural gas, or oil. Almost 3% of the workers in Wyoming where employed by mining or power generation activities that were centered around coal energy. (Scott Madden Management Consultants)
#22. There are currently more than 1,400 coal mines operating in the United States, producing 1.1 million short tons of coal each year. (Energy Information Administration)
#23. 37% of the power that is used to send the 300 billion emails that people receive each day comes from coal energy. (RMCMI)
#24. Coal energy is responsible for 77% of China’s industrial sector right now. The only other country that exceeds this rate of use is India at 78%. (RMCMI)
#25. Over 50% of the electricity that is used in the world today comes from coal energy. That supplies energy to over 3 billion people every day. It is enough power to replace what 1,800 nuclear power plants could provide. (RMCMI)
#26. Coal energy produces 25 TWh of electricity every day. That is more than solar, wind, natural gas, and oil combined. (RMCMI)
#27. 90% of the coal that is mined each year in the United States is destined for domestic consumption. The average person uses 3.7 tons of this fossil fuel every year. (RMCMI)
#28. Roughly 30% of the coal mining operations that are active in the United States right now are owned by public companies. These organizations are responsible for about 75% of the new fossil fuels in this segment that we use each year. (RMCMI)
#29. The United States has produced over 1,000,000,000 tons of coal each year for the past 15 consecutive years. (RMCMI)
#30. There are currently 262,000,000,000 tons of recoverable coal reserves in the United States right now from proven resources. That is enough energy to provide the country with over 230 years of supplies at its current rate of consumption. 94% of America’s fossil energy reserve comes from this resource. (RMCMI)
#31. Coal is currently available in 38 states on approximately 13% of the U.S. land area. (RMCMI)
Fossil Fuel Industry Trends and Analysis
Although there is a push to create more renewable energy resources across our planet right now, the fossil fuel industry will continue to thrive. Numerous forecasts from around the world predict that our levels of global oil consumption will continue rising by over 1 million barrels per day through at least 2030. Natural gas is expected to rise at an even faster rate.
Even if we look closer to the year 2040, the current level of the wild man then will still be at least 15 million barrels per day higher than what we are consuming right now.
Most of the new fossil fuel supplies that will reach the global market are expected to come from Brazil, Canada, and United States. These new resources expect to have profitability at prices that are below $100 per barrel, which should help moderate spikes in commodity pricing.
It will take at least 20 more years for fossil fuels to no longer be a growth industry, and even then it will still likely remain an integral part of the world’s energy system.
Although millions of people visit Brandon's blog each month, his path to success was not easy. Go here to read his incredible story, "From Disabled and $500k in Debt to a Pro Blogger with 5 Million Monthly Visitors." If you want to send Brandon a quick message, then visit his contact page here. Brandon is currently the CEO of Aided.