The break-even point shows the amount of sales volume that is needed for a business to cover its total fixed and variable costs. The profit at the break-even point is zero, and calculating the break-even point is very useful for business owners as they can determine how much sales volume they need to do at a minimum to sustain themselves. It also helps business owners calculate pricing and determine if they can lower their pricing to complete but also stay in business, or how a pricing increase will affect profitability.
Break Even Point Video Tutorial With Examples
At the break-even point, a company is selling enough of its product or services to sustain its operation. If the company sells more than the break-even point, it will make a profit. Likewise if the company sells less than the required sales volume for the break-even point it will be operating at a loss.
It is difficult for many companies to calculate the profitability of each of their products if there are several. The more products that a company has, the more variation in pricing that it has, and the more levels of service it has, the more complicated the break-even analysis will be.
Break Even Point Formula Video Example 1
Break Even Point Formula Video Example 2
Calculating Variable Expenses and Fixed Expenses
Variable expenses are costs that fluctuate when sales increase or decrease. In the following example, a hotdog vendor has expenses that increase every time the vendor sells one hotdog:
Variable Costs Chart
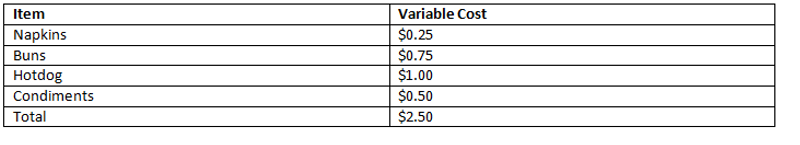
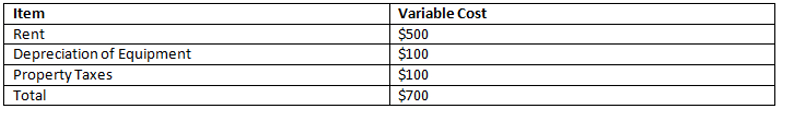
These expenses increase as sales volume increases. However, other expenses do not increase when the sales volume increases, like the rent for the stand, depreciation of the equipment used in the stand, and property taxes. In the example above, the vendor has $2.50 worth of variable costs every time one hotdog is sold.
The vendor sells hotdogs for $5.00 each, with $2.50 remaining after variable costs are deducted. The $2.50 is called the contribution margin, which shows how much money 1 hotdog sale will go towards the company’s fixed costs.
Contribution Margin = Revenue – Variable Costs
If the vendor sells 50 hotdogs per week for instance, he makes $250.00 revenue and a $125.00 contribution margin after the variable costs are deducted from the revenue.
Fixed Expenses Chart (Monthly)
Mixed expenses are partially fixed and partially variable. An example of this is a sales person who has a base salary plus a commission. The base salary is a fixed cost but their commission is a variable cost.
Breakeven Point Formula (in unit sales)
To find the break-even point for monthly unit sales, you simply divide the monthly fixed expenses by the contribution margin for 1 sale of a hotdog.
Monthly break-even point = Monthly fixed costs / Contribution Margin per Unit Sale = Unit Sales per Month
$700 (monthly fixed costs) / $2.50 contribution margin per hotdog sale = 280 hotdog sales per month.
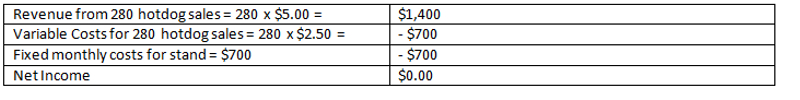
This means that the vendor needs to sell a minimum of 280 hotdogs per month to cover his fixed costs and break-even.
The calculation can be checked by subtracting the variable and fixed expenses from the expected revenue for 280 hotdog sales.
Obviously this is a simple example and most companies would have many other fixed and variable costs to consider, as well as multiple products, but from this example you can get the basic idea on how a break-even point is calculated. From there you can calculate other important data such as the number of unit sales necessary to achieve a particular net profit, the break-even point in a dollar amount, and others.
Although millions of people visit Brandon's blog each month, his path to success was not easy. Go here to read his incredible story, "From Disabled and $500k in Debt to a Pro Blogger with 5 Million Monthly Visitors." If you want to send Brandon a quick message, then visit his contact page here.