Aerospace Industry Statistics and Trends
The United Aerospace and Defense Industry is worth $184.29 billion dollars each year. It experienced a 12.65% growth in 2012 with 69% of the industry production being civil based and 31% defense production. The following statistics provide an overview of the aerospace industry.
Aerospace Industry Sales
The estimated sales for 2013 are $191.73 billion dollars for the Aerospace industry. This is broken down into the following products and services that the industry serves. The top exporters of the United States Aerospace Industry are China, United Kingdom, France, Japan, and Canada.
Department of Defense: $93.16 billion
NASA and Other Agencies: $20.81 billion
Other Customers: $77.76 billion
Related Products & Services: $31.82 billion
Aerospace Industry Net Profit
According to the Aerospace Industries Association, $20.13 billion was earned in net profit in 2012. This is broken down into the follower profit percentages.
• Sales: 7.6%
• Assets: 6.1%
• Equity: 25.5%
For manufacturing corporations the following percentages apply.
• Sales: 8.9%
• Assets: 7.4%
• Equity: 16.4%
Aerospace Sales by Product Group
An estimated $124.29 billion is expected in total revenue for 2013 due to the following product groups of the Aerospace industry.
Civil: $67.48 billion
Military: $56.81 billion
Missiles: $21.84 billion
Space: $31.82 billion
History of Aviation
The following video provides a documentary of the aviation industry and how the first controlled power flight by man lead to the age of mass air travel.
US Aerospace Trade Export
The United States Aerospace industry exports approximately $118.52 billion each year with additional $47.98 billion general imports.
Top 5 Export Destinations
1. China
2. Japan
3. France
4. United Kingdom
5. United Arab Emirates
Top 5 Import Suppliers
1. France
2. Canada
3. Japan
4. United Kingdom
5. Germany
Top US Manufacturers in General Aviation
A listing of the top general aviation manufacturers based on their segments.
Business Jets
1. Cessna
2. Bombardier
3. Gulfstream
4. Embraer
5. Dassault
Turboprops
1. Cessna
2. Pilatus
3. HBC
4. SOCATA
5. Piper
Pistons
1. Cirrus
2. Cessna
3. Diamond
4. Piper
5. American
Aerospace Employment by Subsector
A total of 1.896 million employees are employed by the Aerospace and Defense industry. This is broken down to the following subsectors.
1. Commercial Aircraft and General Aviation – 326,657
2. Defense, Space, and Security – 723,961
3. Subtotal A&D in Scope – 1,050,618
4. A&D Skilled Workers Employed by Federal Government – 845,198
The total revenue earned by each employee by the total industry is $308,364 with this broken down into two additional categories of the following
Revenue earned by each defense, space, and security employee – $279,542
Revenue earned by each commercial aerospace employee – $372,240
Top 5 US Aerospace and Defense Exports
The top five states for Aerospace and Defense exports account for 55.1% of the total industry exports. Washington that sits in the top spot alone produces 25% of the industry exports. The following listing of exports and their value for the top states are outlined below.
1. Washington – $23.525 billion
2. California: $7.735 billion
3. Connecticut: $6.919 billion
4. Texas: $6.100 billion
5. Florida: $5.150 billion
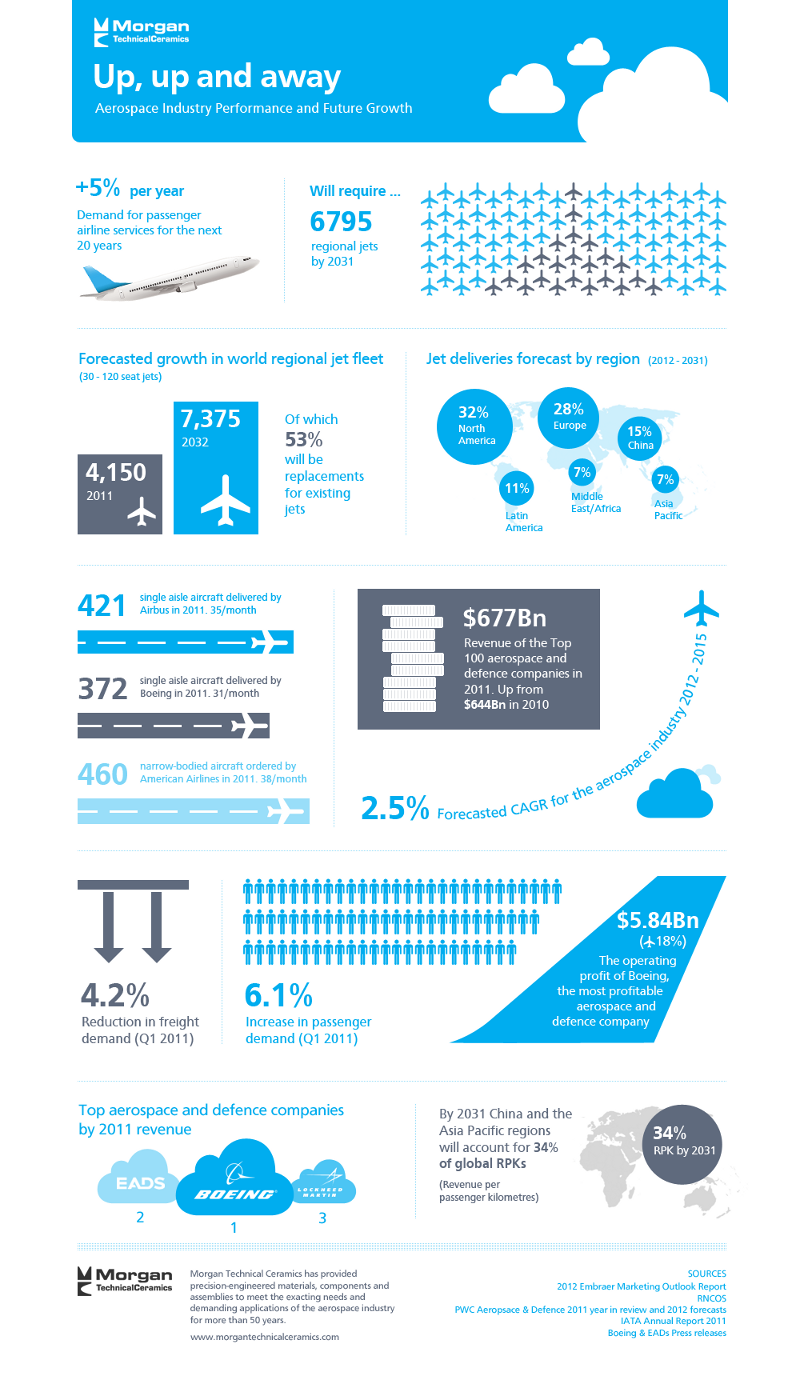
US Aerospace Industry Performance and Growth
The following infographic outlines the industry performance and growth for Aerospace. An increase of 5% per year is expected to occur through a growing demand in passenger airline services. Almost 7,000 more regional jets will be needed by 2031 to meet future demands.
Although millions of people visit Brandon's blog each month, his path to success was not easy. Go here to read his incredible story, "From Disabled and $500k in Debt to a Pro Blogger with 5 Million Monthly Visitors." If you want to send Brandon a quick message, then visit his contact page here. Brandon is currently the CEO of Aided.