From butter to ice cream, cheese to liquid milk, many of the world’s most consumed products are possible because of the milk industry. Consumption of dairy products dates back at least 6,000 years, with every country in the world contributing to this global industry in some way. In 2017, the total volume of the milk industry was an estimated 216 metric tons.
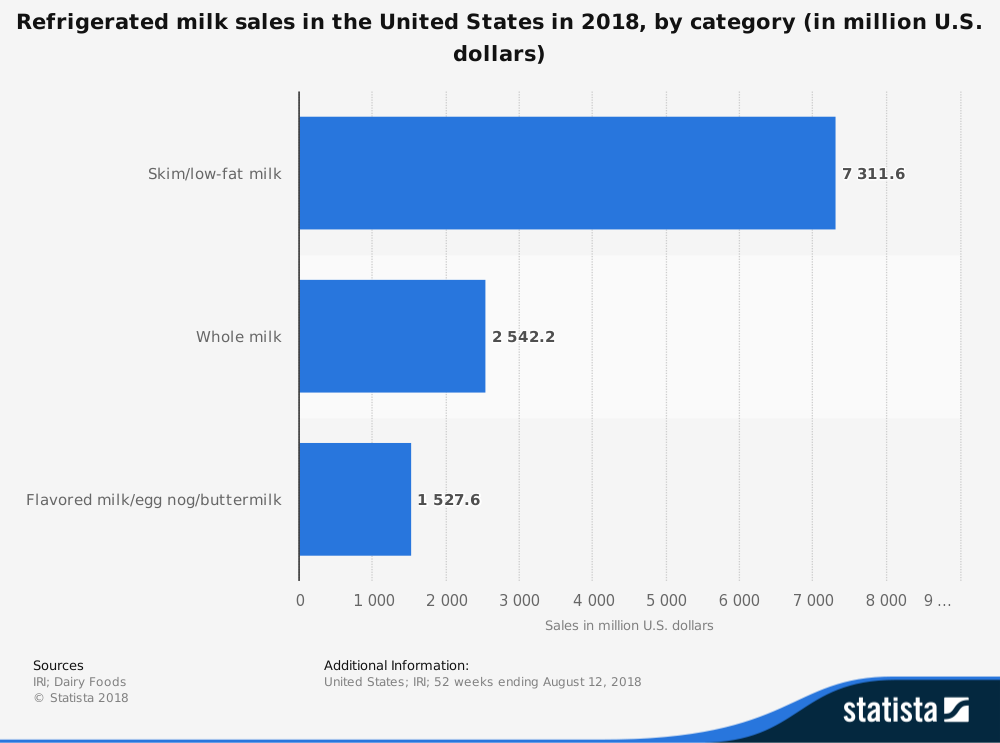
Liquid milk is the most popular product consumed, accounting for 54% of the total market each year. Cow milk is the dairy produce with the largest production volume, with India leading the world with 56.5 million milk cows in the country. Since 2000, China has also tripled its domestic milk production.
Milk is an important export product as well. Over $45 billion in dairy products are exported each year around the world. The European Union controls a 39% share of the milk product export market, thanks to their unique cheese and butter processes. On its own, Germany exports $4.4 billion in cheese each year.
Important Milk Industry Statistics
#1. New Zealand sells the most dairy products to the United States, with over $590 million in exports each year. Canada comes in second with $504 million, followed by Italy ($368 million), Ireland ($241 million), and France ($229 million). (Progressive Dairyman)
#2. The United States exports a total of $5.3 billion of dairy products each year, with Mexico purchasing the most at $1.3 billion. Canada purchases about $636 million worth of milk products, followed by China ($577 million), Japan ($291 million), and South Korea ($279 million). (Progressive Dairyman)
#3. With the exception of Europe and Oceania, the United States has a trade surplus with each trading partner in the global milk industry. (Progressive Dairyman)
#4. About 500 million metric tons of milk are produced around the world each year. (Statista)
#5. Europe exports about 5 million metric tons of milk products each year, with 14.5% of that volume being cheese which originated from Germany. (Statista)
#6. India produces about 5.4 million metric tons of butter that helps to support the global milk industry. (Statista)
#7. Over 43,000 farms in the United States produce milk products that are turned into cheese, yogurt, and liquid milk sales for international and domestic consumption. About 97% of the dairy farms in the United States are classified as being family-owned enterprises. (American Dairy Association)
#8. The average cow in the United States will produce about 7 gallons of milk each day, creating over 2,600 gallons of milk. In India, the average cow will produce about 50% of this rate. (American Dairy Association)
#9. About 20% of the milk production which occurs in the United States is based in California. (American Dairy Association)
#10. With 202 dairy processors, Wisconsin leads the United States in total milk processing capacity. About 1 in 5 processors are based in the self-proclaimed “Dairy State.” Both New York (130) and California (118) have more than 100 processors. Outside of the top 3, Pennsylvania and Ohio are the only states to have more than 60 operational processors. (Progressive Dairyman)
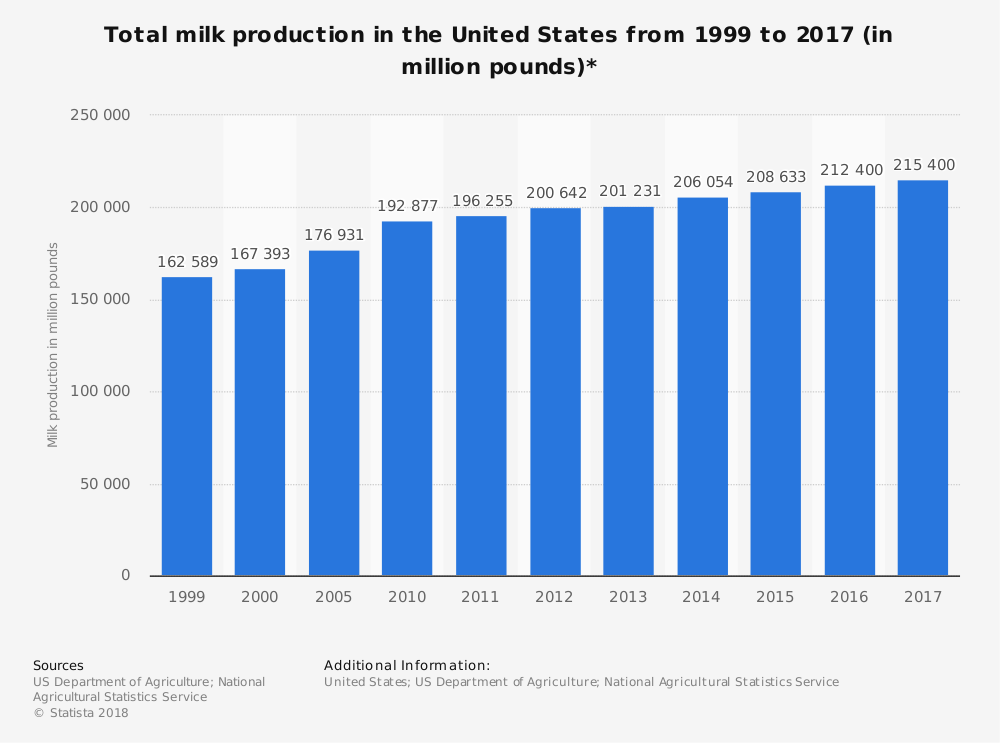
#11. In 2017, total U.S. milk production topped 215 billion pounds, which was an increase of 3 billion pounds from the year before. The milk industry in the United States has reached record highs for milk production in eight consecutive years. (Progressive Dairyman)
#12. Vermont is the state with the highest percentage of farm income from milk products at 68%. They are followed by New York (55%), Wisconsin (53%), and New Mexico (49%). (American Dairy Association)
#13. Per capita dairy consumption was estimated to be 111 kilograms per person in 2015. That rate is expected to increase by more than 12% over the next decade. (International Dairy Federation)
#14. 29% of the global milk production comes from Asia, followed by 24% coming from Europe. North and Central America are responsible for 18% of production. (International Dairy Federation)
#15. From 2005 to 2015, the output of cheese products increased by 23%. Butters and oils grew by 39%, while SMP grew by 43%. Over 20 million tons of cheese is produced each year for consumption by the milk industry. (International Dairy Federation)
#16. China leads the world in producer milk prices, registering a rate of $63.67 per 100kg in 2015. India had prices of $41.19 per 100kg. The rest of the world hovers between the $30 to $35 range in pricing. All major sectors saw declines in dairy prices from 2014 to 2015. (International Dairy Federation)
#17. From 2003 to 2017, the total pounds of milk produced by the average cow in the United States has increased from 18,760 pounds per year to almost 23,000 pounds per year. (Progressive Dairyman)
#18. Even though milk production is increasing in the U.S. milk industry, the total number of licensed herds is decreasing. In 2003, there were more than 70,000 licensed herds. At the end of 2017, there were only 40,000 licensed herds. (Progressive Dairyman)
#19. Wisconsin has more licensed herds for milk production than any other state in the U.S. at more than 9,000. Pennsylvania comes in second with 6,570 licensed herds, followed by New York (4,490), Minnesota (3,210), and Ohio (2,380). Even though California leads the U.S. in total milk production, it doesn’t even crack the top 10 in herd numbers. (Progressive Dairyman)
#20. The national dairy herd size in the United States was 234 head in 2017, which was up 4.7% (11 cows) from the year before. (Progressive Dairyman)
#21. 60% of the top dairy producing counties in the United States are located in California. Idaho has two counties in the top 10, while Arizona and Washington each have one. Clark County, WI doesn’t record the first state entry until the 21st ranking. (Progressive Dairyman)
#22. Wisconsin leads the United States in the number of farms that are certified as being organic milk producers. There are currently 439 farms, with a total herd of 27,800, currently certified in such a way. New York offers 377 organic farms, followed by Pennsylvania (275), Indiana (183), and Ohio (181). (Progressive Dairyman)
#23. Nine states in the U.S. only have 1 certified organic farm in operation. Three states only have 2 farms, while there are four states which have 3 farms. (Progressive Dairyman)
#24. Although milk exports grew by 15% in 2017 for the United States, skimmed milk powder (SMP) saw a volume gain of just 12,000 tons. European exports of SMP grew by over 200,000 tons over the same period. (U.S. Department of Agriculture)
#25. Fluid milk exports increased to $562 million for the EU-28 in 2017, a dramatic improvement from the $353 million achieved in 2013. Those gains are occurring despite the fact that volumes have decreased. 36% of the exports from Europe are directed toward China. (U.S. Department of Agriculture)
#26. The rate of cheese production was up 2% in 2017 when compared to the year before. An additional 200,000 tons of cheese were produced, with most of the products being absorbed into domestic markets. (U.S. Department of Agriculture)
#27. Shipments of cheese from Europe to the United States are down by 10% in 2017. Japan experienced a 3% decline in their European cheese imports as well. About 840,000 tons of cheese are expected to be exported to these countries in 2018 because of the increasing strength of the Euro against the Dollar and Yen. (U.S. Department of Agriculture)
#28. The United States expects to export 334,000 tons of cheese in 2018, which would be a decline of 3% from the previous years. Cheese imports dropped 17% in 2017 as well, which shows how competitive the American market happens to be. (U.S. Department of Agriculture)
#29. In 2017, Canada had just under 11,000 farms which offered milk shipments. The national herd totaled 945,000 dairy cows, with 454,300 heifers counted. (Canadian Dairy Information Center)
#30. Quebec has more farms (5,368) than any other province in Canada. When combined with Ontario’s farms (3,613), the two are responsible for about 90% of the dairy farming activities which occur in the country. No other province has more than 550 active farms. (Canadian Dairy Information Center)
#31. 75% if the dairy barns which are operated in North America are tie stall facilities. The remainder of barns that are recorded are classified as free stall facilities. (Canadian Dairy Information Center)
#32. 91% of free stall barns are equipped with robotic milking systems, compared to the 8.5% of farms in Canada with robotic systems as a tie stall operation. (Canadian Dairy Information Center)
#33. About 1.2 million hectoliters of certified organic milk are produced in Canada each year through the efforts of 232 producers. The rate of organic milk production has nearly doubled since 2008. (Canadian Dairy Information Center)
#34. Total dairy cash receipts in Canada totaled $6.56 billion in 2017. Quebec was responsible for 36% of these revenues, compared to Ontario’s 32% share. British Columbia, despite having fewer farms than Alberta, had a higher share of cash receipts at 9.5% vs. 9%. (Canadian Dairy Information Center)
#35. Whole, fresh cow milk represents 82% of global milk production. That is followed by buffalo milk (13%), goat milk (2.3%), and sheep’s milk (1.3%). (FAO)
#36. 14% of the global agricultural trade which occurs each year involves products from the milk industry. Whole milk powder (WMP) and SMP are the most-traded agricultural commodities as a percentage of production traded. (FAO)
#37. There are 570 million farm holdings globally which are associated with the milk industry. 25% of the farmers keep at least one milk animal, including 133 million farms which own at least one dairy cow. (FAO)
#38. Farms with more than 100 dairy cows represent just 0.3% of the total number of dairy farms around the world. Most farmers with dairy cattle keep them in herds of just two or three animals. (FAO)
#39. Milk contributes an average of 134 kcal of energy per day, along with 8.3g of protein and 7.6g of fat. That represents 5%, 10%, and 9% of the total daily nutritional intake of each item. Milk is the third-largest provider of protein and fat for human consumption. (FAO)
#40. In 25% of the households which own dairy cows, women directly own the livestock. Almost 40 million farms around the world are headed by a woman. (FAO)
#41. For processed milk products, 75% involved skimmed milk, 12% involved cheese, and 3% involved butter. More than 470 million jobs are associated with these activities in the global milk industry. (FAO)
#42. In developing countries, there are up to 6 full-time jobs created for every 100 liters of milk that are traded. As a comparison, there are 13,000 dairy farms in the U.K. which create 28,000 full-time farming jobs. (FAO)
#43. 69% of bovine pathogens are present the world over. Over 40% of these pathogens can be transmitted from humans to other humans. With 45 zoonotic pathogens identified, the milk industry also plays a critical role in public health and safety. (FAO)
#44. Feeding dairy cows for the milk industry requires 1 billion hectares of land for pasture, water, energy, and nutrients. That means about 7% of the total land on the planet is used to support the industry in some way. (FAO)
#45. The dairy herd consumes about 2.5 billion tons of dry matter each year to support the creation of dairy products. 77% of the food produced in this way is either straw or grass, allowing the cattle to convert non-edible foods into something that benefits the human nutritional process. (FAO)
#46. The milk industry is responsible for about 40% of global livestock emissions, with dairy cattle producing 75% of the greenhouse gases which are released each year. (FAO)
#47. Over 150 million farmers are directly and indirectly supported in their livelihoods because of the dairy sector. Numerous indirect employment opportunities are created along the value chain as well. (FAO)
Milk Industry Trends and Analysis
The global milk industry provides a source of nutrition for billions of people around the world. As transportation and storage methods improve, the need for additional milk to produce consumable products is expected to increase. Although domestic milk production expansion is somewhat minimal for many nations, there is a shift in farming revenues as cows are able to produce more milk over the course of a year.
There is also a shift from Europe and North America to China and Oceania for liquid milk products on the global stage. Although Europe will likely always lead the way for dairy products such as butter and cheese, the Asia-Pacific region is one of the few areas that is working to expand their dairy networks.
That is why you’re seeing a shift in export tendencies. The consumption of dairy products per capita in the developing world is expected to increase by 1.7%, whereas an increase of just 0.5% is anticipated in the world’s mature economies.
Although the global market should stay strong, retaliatory tariffs between China, Mexico, and the U.S. are creating industry disruptions. Higher domestic milk prices, combined with higher demand levels, will encourage global farmers to continue improving the supply.
Expect to see volume increases of 1% to 3% in the next 10-year period for the global milk industry, along with 2% to 5% increases in milk pricing.
Although millions of people visit Brandon's blog each month, his path to success was not easy. Go here to read his incredible story, "From Disabled and $500k in Debt to a Pro Blogger with 5 Million Monthly Visitors." If you want to send Brandon a quick message, then visit his contact page here. Brandon is currently the CEO of Aided.