The history of coal mining dates back thousands of years, even though it was an essential component of the Industrial Revolutions of the past 200 years. We use this product to generate electricity, heat our buildings, and even to power old-fashioned steam engines. Despite the particulate release that occurs, we continue to use coal because it yields a higher energy level per mass when compared to wood fuels.
We can also obtain coal in areas where other resources may not be available immediately. The coal industry has transitioned away from residential use to industrial needs, especially when looking at alloy production and smelting. Most of our coal consumption is directed toward electricity production.
Although over 90% of the coal production of the United States goes to electricity generation, that figure drops to 38% when looking at the global use of this resource. It supplies about one-third of all energy use worldwide. Despite the legitimate concerns of greenhouse gas emissions from this industry, imports around the world continue to rise, recently topping 800,000 ktoe for the first time.
Important Coal Industry Statistics
#1. Total coal production in the United States rose by 6.4% in 2017, reaching a level of 774.6 million short tons (MMst) for the year. (U.S. Energy Information Administration)
#2. The total productive capacity for coal production in the United States for 2017 was 1,058.6 MMst, which was a decrease of 0.9% over the previous year. Total mining productivity decreased by 0.9% as well, with each employee hour creating 6.55 short tons. (U.S. Energy Information Administration)
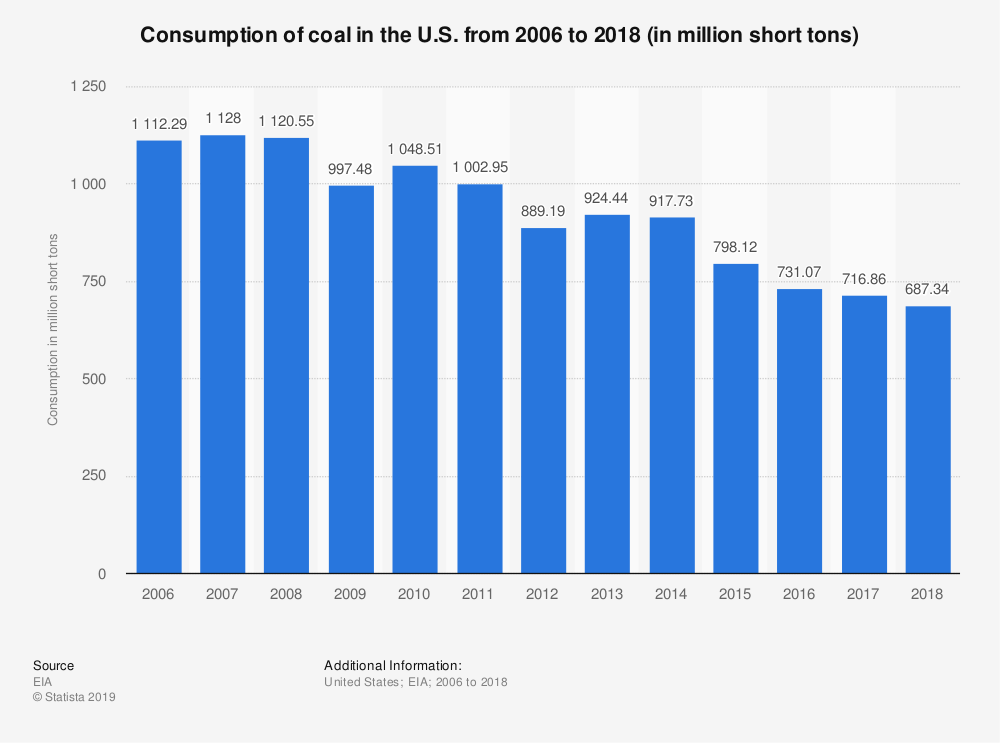
#3. Consumers used 1.9% less coal for their energy needs in the United States in 2017, consuming 716.9 MMst. Almost all of the resources from the coal industry for the year went to electricity generation, which was responsible for almost 93% of use. (U.S. Energy Information Administration)
#4. The average sales price for bituminous coal in the United States in 2017 was $55.60 per short ton, which was an almost 15% increase from the year before. Subbituminous coal saw a decrease of 3.6% in price to $14.29 per short ton, while the cost of thermal coal went down 3% to reach $26.53 per short ton. (U.S. Energy Information Administration)
#5. The average price for metallurgical coal in the United States rose by 61.7% in 2017 to reach $132.82 per short ton. (U.S. Energy Information Administration)
#6. Total stocks of all coal in the United States ended at 167 MMst, which was about 14% lower than what was kept in reserve the year before. Electrical power stocks for the coal industry saw the steepest reduction, losing 24.8 MMst for the year. (U.S. Energy Information Administration)
#7. The average number of employees in the mining sector of the U.S. coal industry rose by 2.4% in 2017 to reach more than 53,000 full-time positions. (U.S. Energy Information Administration)
#8. The average age of a coal miner in the United States is 43, with only 3% of the workers having a four-year degree or beyond. Women make up just 6% of the full-time positions that are available in the industry today. (National Mining Association)
#9. Workers on the job in 2018 had an average of 16 years of experience working in the coal mines, but they received only eight hours of safety training as a refresher course. Even new employees only receive 24 hours of safety training before they start to work. (National Mining Association)
#10. The average coal miner in the United States earns about $33 per hour, which translates to just under $90,000 per year before taxes. It takes about 47 hours per week to reach the production levels that are necessary in the industry today. (National Mining Association)
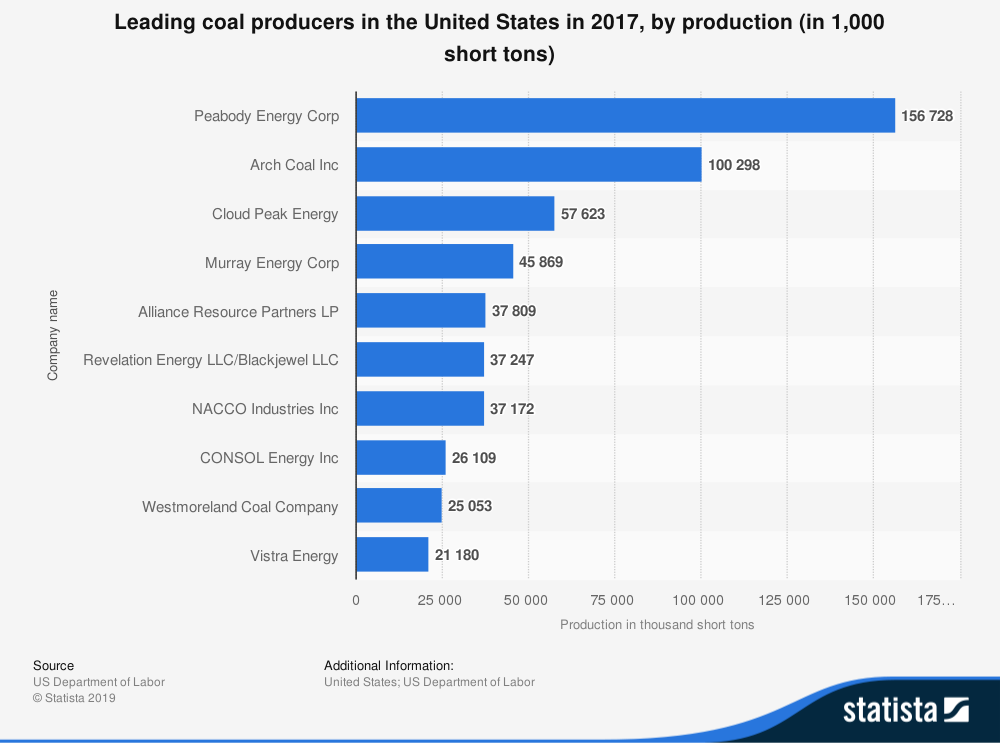
#11. Wyoming leads the United States in terms of total coal mining production, with over 316,000 short tons produced in 2017. Almost all of the coal in the state comes from surface mining. That is more than the next two leading states (Pennsylvania and West Virginia) combined, who produce 96,000 and 92,700 short tons respectively. (National Mining Association)
#12. Texas consumes the most coal in the United States at more than 94,117 thousand short tons per year. That is more than double that of Indiana, who finished in second in 2017 at 41,315 thousand short tons. Missouri, Illinois, and Ohio round out the top 5 at 40,437, 37,889, and 32,438 thousand short tons respectively. (National Mining Association)
#13. Rhode Island and Vermont did not register any coal consumption for 2017. (National Mining Association)
#14. At a consumption level of 12.7 quadrillion BTUs, the U.S. electric power sector consumed more coal than any other sector in 2017. Coal-fired power generation in the United States reached 1,711 terawatts. (Statista)
#15. Despite the recent increases in coal production in the United States, China remains the world leader in this area. In 2017, over 2.62 thousand Mtoe were produced for the year, which was about four times more than the U.S. created. India added another 474 Mtoe for the year, while Australia added 339 Mtoe. (World Energy Council)
#16. Europe holds the largest levels of recoverable coal reserves in the world, with about 30% of future availability believed to be on the continent. Another 28% of the reserves are found in North America. (World Energy Council)
#17. 54% of the global coal recoverable reserves are believed to be subbituminous or lignite. (World Energy Council)
#18. Global coal consumption increased by 1.4% in 2018, which is the fastest level of growth experienced by the industry since 2013. The Asia-Pacific region now represents over 75% of global consumption, which is significantly higher than in 2008 when it was responsible for 67% of consumption. (British Petroleum)
#19. OECD demand for coal fell to its lowest levels since 1975 for the coal industry. Its share in primary energy production fell to 27.2%, which was also the lowest levels in the past 15 years. (British Petroleum)
#20. Three countries account for more than 70% of the coal exports that happened in 2018. Australia led the way with 29% of the market, followed by Indonesia at 26%, and then Russia at 16%. Almost 80% of the coal that was traded was imported by India (55% of the market) and the rest of the Asia-Pacific region. (British Petroleum)
#21. India saw a 25.5% increase in the amount of coal imports it purchased in 2918, with deliveries from Australia, South Africa, and Indonesia accounting for 84% of their total. (British Petroleum)
#22. China saw a 4.6% increase in coal imports in 2018, helping the nation to remain the largest coal importer in the world. 35% of their purchases came from Australia, while 31% of them came from Indonesia. (British Petroleum)
#23. In 1973, over 35% of the world’s carbon dioxide emissions were caused by coal, while 49.9% of them were due to oil combustion. In 2015, coal accounted for about 45% of all emissions, while oil dropped to 34.6%. (World Economic Forum)
#24. China recently scrapped the idea of building an additional 85 coal-fired power plants, choosing to invest over $360 billion into renewable energy solutions instead. A province in the northwestern part of the country even ran on 100% renewable energy for seven days in the recent past. (World Economic Forum)
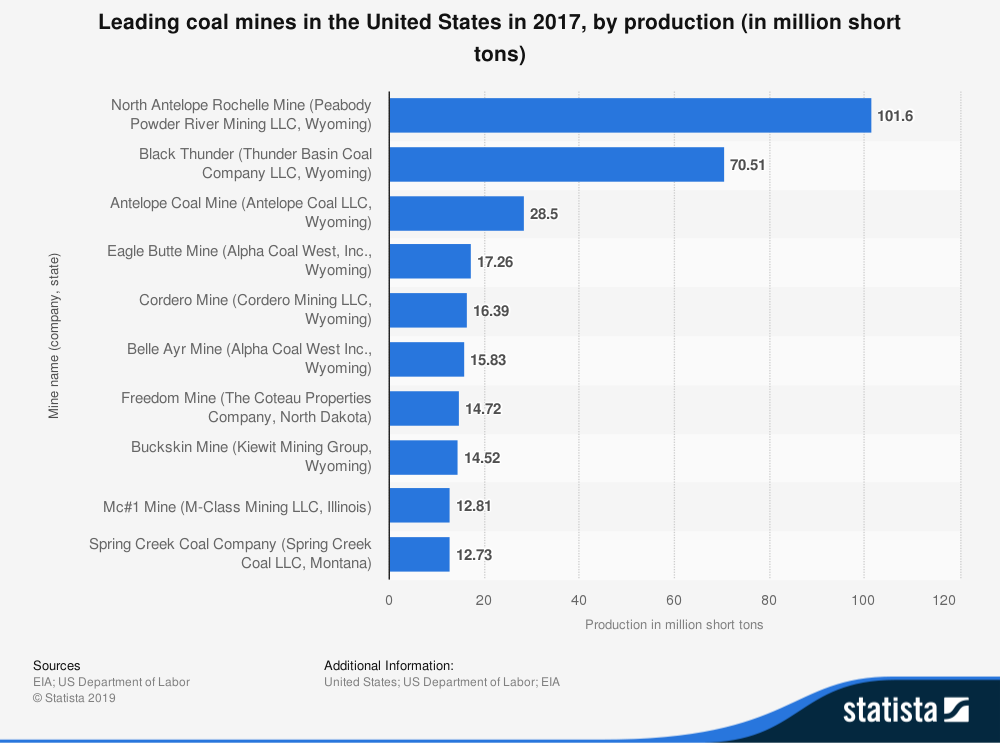
#25. The North Antelope Rochelle Mine in Wyoming is the most productive one in the United States, responsible for over 101.5 million short tons of coal in 2017. Seven out of the top eight mines that produce coal in the U.S. are located in Wyoming, with only the Freedom Mine in North Dakota (15.8 million short tons) creating an exception. (U.S. Energy Information Administration)
#26. Coke production in 2017 was 12,948 thousand short tons for the United States, with almost all of the product being used domestically. Only 1,209 thousand short tons reached the export market. Those figures are about five times lower than the coke production levels in the 1940s. (U.S. Energy Information Administration)
#27. There are currently 695 coal mines operating in the United States, with 622 of them operating east of the Mississippi River. Despite the overwhelming numbers for the eastern part of the country, the coal mines of the west have almost double the total production. (U.S. Energy Information Administration)
#28. Pennsylvania leads the United States in the total number of active coal mines, with 172 of them operating in 2017. 41 of those facilities are underground mines, producing 41,000 thousand short tons of coal per year. (U.S. Energy Information Administration)
#29. Since 2000, the total level of coal production in China has increased by 139%. (World Coal Association)
#30. Almost all of the global coal production that occurs is used in the country where it was mined. About 15% of the hard coal that comes from the ground goes toward the international market for this energy resource. (World Coal Association)
#31. Surface mining for coal is only economical when the seams are near to the surface. This method can recover over 90% more coal than underground mines, but large opencast facilities can cover several square kilometers of space. (World Coal Association)
#32. The U.S. share of energy that comes from hard coal production is 38%, responsible for 636.5 million tons of coal electricity generation. (Statista)
#33. Coal mining employment in the United States has dropped by almost 40% since 2009, when there were 87,000 full-time positions available in the industry. About 60% of the jobs which are available in the United States are for underground positions. (Statista)
#34. Coal is consistently the cheapest natural energy resource in the United States, with a cost of just $2.06 per 1 million BTUs in 2017. Natural gas was $3.37 during the year using the same measurement, while petroleum was at $7.10. (Statista)
#35. Thanks to the low cost of coal-fired electricity generation, the price of electricity to end users in the United States was just $0.13 per kilowatt hour in 2018. (Statista)
#36. The Netherlands is consistently the top purchaser of American coal products each year, importing over 9,300 thousand short tons in 2017. Brazil imported over 7,500 thousand short tons that year, while Germany imported 4,900 thousand short tons. (U.S. Energy Information Administration)
#37. The United Kingdom imported 13,500 short tons of coal from the United States in 2013, but that figure dropped to just 2,700 short tons in 2017. (U.S. Energy Information Administration)
#38. Deploying high-efficiency, low-emission (HELE) coal-fired power plants can help to reduce the number of emissions that the coal industry produces through electricity generation each year. When combined with carbon capture, use, and storage technologies, the entire power sector could reduce their emissions by 20%. (World Coal Association)
#39. A 1% improvement in the efficiency of a conventional pulverized coal combustion plant translates to up to a 3% reduction in carbon dioxide emissions. (World Coal Association)
#40. Each person in the United States consumes about 3.7 tons of coal over the course of the average year. (Rocky Mountain Coal Mining Institute)
#41. In the last 24 hours, coal energy helped to provide 37% of the power that was responsible for sending over 300 billion emails around the planet. (Rocky Mountain Coal Mining Institute)
#42. Coal energy produces 25 terawatts of electricity in 24 hours in the United States, which is more than solar, wind, natural gas, and petroleum combined. (Rocky Mountain Coal Mining Institute)
#43. Coal-powered power plants generate the same amount of energy that 1,800 nuclear plants would produce in the United States each day. The industry is responsible for providing more than half of the electricity that over 3 billion people use every day. (Rocky Mountain Coal Mining Institute)
#44. The coal industry produces enough raw materials that it enables the production of 3.1 million metric tons of steel each day. This attribute allows it to fuel 78% of India’s industrial sector and 77% of China’s at the same time. (Rocky Mountain Coal Mining Institute)
#45. About 30% of the mines that produce coal in the United States are owned by public companies. These firms are responsible for producing about 75% of the coal that we use every day. (Rocky Mountain Coal Mining Institute)
#46. About 50,000 new employees will be needed in the next decade to meet the increasing demand levels for this natural resource. (National Mining Association)
Coal Industry Trends and Analysis
As we move away from the progress made during the industrial revolutions in Europe and North America, the Asia-Pacific region is going through one of its own. Between the surge in power needs in China to fuel their export market to the development seen in Southeast Asia as economies begin to modernize, there is a definitive shift in emphasis for the coal industry and their sales.
A shift to clean coal energy that can trap the potentially harmful greenhouse gas emissions offers an opportunity to breathe new life into the industry. With the mature economies seeing significant drops in coal use, the industry must look for ways to continue modernizing while reducing or eliminating its potential environmental impact.
The current global R/P ratio is also concerning, with 2018 coal reserves accounting for 132 years of current production. North America has 342 years, while the CIS has 329 years available. It was once thought that the peak production levels of 2013 would never be reached, but recent surges of use might change that fact.
Although millions of people visit Brandon's blog each month, his path to success was not easy. Go here to read his incredible story, "From Disabled and $500k in Debt to a Pro Blogger with 5 Million Monthly Visitors." If you want to send Brandon a quick message, then visit his contact page here. Brandon is currently the CEO of Aided.