In the 2016 election cycle, many politicians have talked about the need for equality. Each politician has their own unique take on the us vs. them argument. For Donald Trump, it’s Muslims vs. the rest of the nation. For Bernie Sanders, it’s the richest 1.5% vs. the rest of the nation. Yet in the US Congress, the demographics paint an interesting picture that is often not talked about.
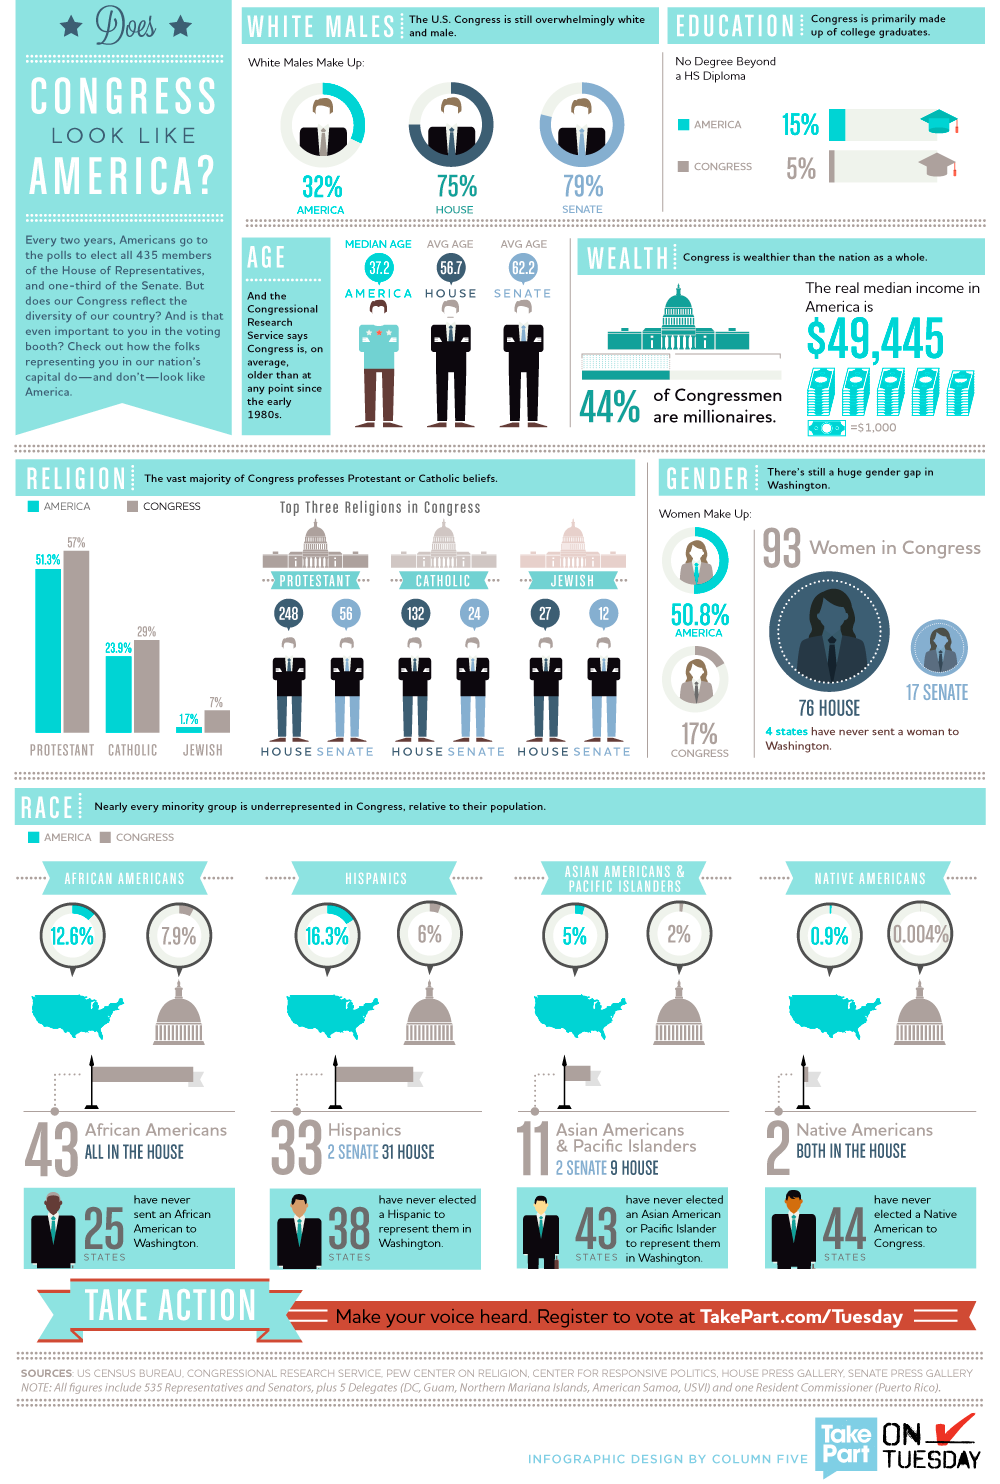
For the 114th US Congress in 2015, it was made up of 80% white men and 92% professing Christians.
Because each election cycle has the potential to change the demographics of the US Congress, one cannot accurately say what each Congressional cycle will look like. What might be most shocking about the above demographic fact is that the 114th US Congress is considered to be the most diverse in history.
The US Congress is composed of 541 individuals from the 50 states, the District of Columbia, Guam, the U.S. Virgin Islands, American Samoa, the Northern Mariana Islands, and Puerto Rico. This count assumes that no seat is temporarily vacant and many of these US Congress demographics are provided by the Congressional Research Service.
Party Affiliation in the 114th Congress
- As of October 31, 2015, in the House of Representatives, there are 247 Republicans, which includes 1 delegate.
- There were 193 Democrats, including 4 delegates and the Resident Commissioner of Puerto Rico.
- The House also had 1 seat vacant as of the date listed in this set of demographics.
- The US Senate had 54 Republicans, 44 Democrats, and 2 Independents, although both Independents caucus with the Democratic Party.
- The average age of a US House of Representatives member was 57 at the beginning of the session. For the US Senate, the median age was 61. This average age is one of the highest that has been seen in recent US history.
- An overwhelming majority of Congressional have a college education, with the top degrees being in politics/public service, business, or law.
- The average length of service of a member of the US House was 8.8 years. In the US Senate, it was 9.7 years.
- The oldest senator in the 114tth Senate was 81 at the start of the session. The youngest senator was 37.
- The oldest representative in the 114th House was 85 and the youngest representative was just 30.
Republicans were able to sweep into their largest majority in more than two generations with the 114th Congress. This may skew this US Congress slightly more than the overall historical demographics may indicate, yet the trend toward a little more diversity is happening. What is unique about this specific cycle is that 53 Senators have previously served in the US House and 100 members worked in the field of education at some point in their lives. There are 18 physicians serving in the US Congress, 3 dentists, and even 3 veterinarians. This means you can also serve in the US Congress is that is something to which you aspire.
Breaking Down the House and the Senate
- Women made up 19.4% of the membership in the House of Representatives in the 114th US Congress.
- 20% of the US Senate in 2015 was composed of women.
- In total 108 women, which is a record number, are serving in the 114th Congress.
- 79.8% of the House of Representatives is White/Caucasian. This is compared to the 10.1% that is African-American/Black, 7.8% that is Hispanic, and 2.3% that is Asian. The 114th Congress has more Asians serving than ever before.
- In the Senate, 94% of its members are Caucasian/White. There are 3 Hispanic senators, 2 African-American/Black senators, and just 1 Asian senator.
- 2 Native Americans are currently serving in the House of Representatives.
- The most common religious affiliation in the US Congress is Catholicism at 31%. The next most common affiliation is Anabaptist, though 57% members identify with one of the Protestant denominations. More Congressional members, however, simply identify themselves as being “Christian” instead of being in a specific Christian denomination.
- The most underrepresented demographic in the US Congress are those without a religious affiliation, which is 20% of the US public, but just 0.2% of Congress.
- Almost 1 in 5 members of the House and Senate belong to a racial or ethnic minority.
- Non-white members make up 17% of the US Congress population, which is less than half of their share of the general US population.
The US Congress might be overwhelmingly white and overwhelmingly Christian, but progress is being made slowly, but surely toward a more diverse environment. In 1981, for example, just 6% of the US Congress belonged to a minority racial or ethnic population. When the 107tth Congress took office, minorities accounted for 12% of the Congressional population. The largest growth has been seen in the Hispanic population over this time period, thanks in part to the higher levels of immigration in this population base. Despite the improvements, however, there is still much work to be done when it comes to Congressional diversity.
The US Population and Their Representative in Congress
- 35% of the nation’s black population is represented by a Congressional representative who is black, which is the highest percentage of any minority group.
- 22% of Hispanics are represented by a Congressional representative who is also Hispanic.
- 12% of Asians are represented by a Congressional representative who is Asian.
- Just 8% of Native Americans/First Nations/Indians are represented by someone of the same ethnic or racial group.
- Since 2001, the number of House Democrats who are minorities increased by 18, from 56 then to 74.
- There has been an increase of 7 representatives among House Republicans who are minorities since 2001 as well, rising from 4 then to 11 now.
- In the last 10 years, newly elected representatives are 3 years older, but newly elected senators are 7 years younger.
There is something to be said about having someone from the same ethnic background being your representative in the US Congress. People who grew up in similar conditions have a better awareness of what your needs happen to be. If you are a poor African-American/Black family barely scraping by, then how is someone who is White/Caucasian from a family with inherited wealth going to understand what your needs happen to be? Just because someone comes down to your neighborhood and shakes your hand doesn’t mean they know who you are. Minorities need to be more than just a photo-op. The US saw progress in the last election cycle – will that progress continue?
Lifestyle as a US Congress Demographic
- Despite a 92% affiliation with Christianity, there are just 7 ordained ministers that are serving in the 114th US Congress and all of them serve in the House of Representatives.
- 10 members are actively enrolled in the US military reserves and 7 members are members of the National Guard. 101 members have either served or are actively serving in the US military at this time.
- 24 members of the US Congress hold a doctoral degree.
- 98% of the US Congress lists a specific religious affiliation.
- Just 2 House members are Buddhist, 2 are Muslim, and 1 House member is Hindu.
- 13 Representatives and 3 Senators were born outside of the United States, representing Canada, Cuba, Guatemala, Japan, Peru, and Thailand.
- 82 Members of the House and 16 Senators earned a master’s degree as their highest attained degrees.
- Just 20 Members of the House have no educational degree beyond a high school diploma.
- 8 Members have an associate’s degree as their highest level of education.
- 29 Members of the US Congress have listed their occupation as farmers, ranchers, or cattle farm owners.
- There are 19 insurance agents or executives currently serving.
- The US Congress has 5 software company executives in the House and 2 in the Senate.
- 41 mayors are currently serving in the US Congress, along with 10 former state governors and 8 lieutenant governors.
- 43 prosecutors and 15 former judges are also serving.
- There are 3 former US ambassadors as Members, along with one former Cabinet Secretary.
- 102 current Members served as congressional staffers in the past, as well as 7 congressional pages.
The bottom line is this: anyone can become a politician and serve in the US Congress if that’s what they wish to do. Social workers, Peace Corps volunteers, and even a microbiologist are all part of this group of government officials. There are people who are incredibly rich and there are people who come from very poor backgrounds. There’s even a screenwriter who is serving in the US House right now. In order for the US Congress to become more diverse, it needs people like you who are willing to run and serve your district. Sometimes the best way to create change is to be the one to initiate it.
Although millions of people visit Brandon's blog each month, his path to success was not easy. Go here to read his incredible story, "From Disabled and $500k in Debt to a Pro Blogger with 5 Million Monthly Visitors." If you want to send Brandon a quick message, then visit his contact page here. Brandon is currently the CEO of Aided.