Most people are going to find themselves unemployed at some point in their lives. Sometimes being unemployed is a choice, such as transitioning to retirement. At other times, external factors cause layoffs and force people into unemployment. Since 1992, the Bureau of Labor Statistics in the United States has been tracking unemployment data.
People who have an education that is less than a high school diploma are 3x more likely to be unemployed than someone with a Bachelor’s degree or higher.
Many of the demographics are tracked based on the age of the worker being 25 years of age or higher. Yet teen workers, individuals with disabilities, and other demographics also face unemployment challenges. Here is a look at some of the key demographic points.
How Unemployment is Affected by Ethnicity and Gender
- Black or African American workers in the United States are 2x more likely to be unemployed than white workers.
- Asian workers had a 3.9% unemployment rate in February 2016, which was lower than White workers at 4.3%.
- Hispanic or Latino workers had a 5.4% unemployment rate. Asian workers have had the lowest unemployment rate in the US as an ethnicity since 2009.
- Black or African American workers have had the highest ethnic unemployment rates in the US since 1996, with rates from 2009-2012 reaching nearly 18% some months.
- For Black or African Americans in the 16-19 age demographic, the June 2014 unemployment rate was 33.4%, which was well above peak national unemployment rate of 25% during the Great Depression.
- Even during the recession years of 2007-2009 and the following aftermath, White unemployment rates never exceeded 10% and Asian unemployment rates never exceeded 9%.
- In February 2016, men and women had the same 4.9% unemployment rate.
- Men historically have had higher unemployment rates than women. In 2009, women were nearly 2x more likely to be employed compared to men.
In the United States, Asians and Whites tend to have the most opportunities on paper. In 2010, Asians were 3x more likely to be hired for work than Blacks or African Americans. Although the unemployment curves are similar for all ethnicities, the Hispanic or Latino and Blacks/African Americans have higher unemployment rates. The only exception to this was a brief spike of Asian unemployment in 1999 and in 2007 that drove their ethnic unemployment rates to a nearly equal level compared to African-Americans.
How Unemployment is Affected by Age
- Unemployment in the 16-19 age demographic stood at 15.6% in February 2016.
- When the age demographic is expanded to 16-24 year-olds, which the BLS still classifies as “youth workers,” the unemployment rate drops to 10.5%.
- In comparison, workers in the 25-34 age demographic have a 5.1% unemployment rate and this has been trending downward since late 2009.
- Workers in the 35-44 age demographic have a comparable 3.8% unemployment rate as seniors in the 55+ age demographic.
- The lowest unemployment rates in age are in the 45-54 demographic, with an unemployment rate of 3.5%.
Since 1996, the trend for age demographics in the US in regards to unemployment has been that older workers are more likely to find work. The unemployment curves are virtually identical for the last 20 years and younger workers are always more likely to be unemployed than older workers. This indicates that age is a factor to consider when looking at individual employment stability.
How Unemployment is Affected by Disabilities
- The unemployment rate for persons with a disability was 12.9% in figures from 2014, which is nearly 3x higher than workers without a disability.
- The participation rate for employment within the labor force for persons with a disability is just 19.5%. For people without disabilities, labor force participation is at 68.2%.
- Persons with a disability were about 3x as likely as those with no disability to be in the 65 and over age demographic.
- The employment-population ratio is much lower for persons with a disability than for those with no disability.
- Unemployment rates were higher for persons with a disability than for those with no disability among all educational attainment groups.
- 33% of workers with a disability were employed part-time, compared with 18% for those with no disability, from 2014 data.
- Employed persons with a disability were more likely to be self-employed than those with no disability.
- Women are slightly more likely to have a disability when compared to men, while Blacks or African Americans and Whites had a higher prevalence for disabilities compared to Hispanics/Latinos or Asians.
Why are so many persons with disabilities hired part-time or working in a self-employment setting? It’s because many need some basic assistance to help maintain that employment. Many organizations throughout the United States assist workers with disabilities in their daily job duties. Some even offer employment counselors that work alongside these workers. The US government even offers certain tax breaks to qualifying businesses which hire persons with disabilities, yet the unemployment rate and labor force participation rates are historically poor compared to persons without a disability.
Is Unemployment Getting Better or Worse?
- The average duration of unemployment in October 2013 was nearly 3x as long as it was in October 2000.
- Since 2008, the number of Americans of working age that are classified as not being in the labor force has risen by more than 11 million people.
- 1 out of 4 part-time workers in the US is currently living below the poverty line.
- Since 2000, nearly 30 million working age US citizens do not have a job.
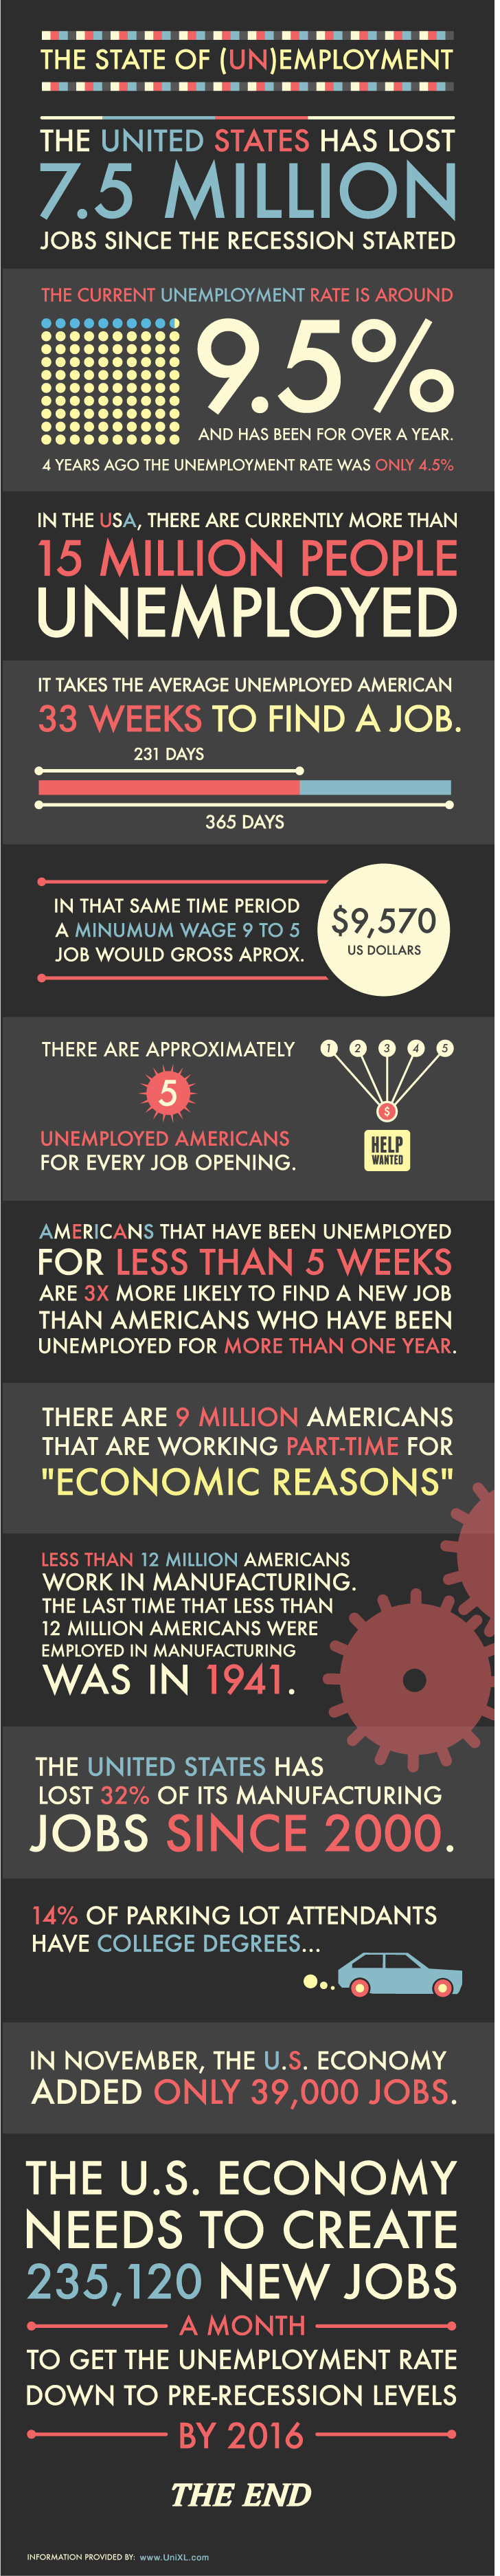
- The United States economy has experienced a loss of 7.5 million jobs since the start of the Great Recession in 2008.
- For every job opportunity that is offered, there are 6 unemployed workers who will be competing for that position.
- An individual from any demographic is who has been unemployed for under 5 weeks is 3x more likely than an individual who has been unemployed for longer than 5 weeks to obtain full-time employment.
Unemployment continues to be a challenge for all demographics in the US. Yet some of the data which seems alarming may not be as negative as it seems. People who work freelance and some self-employed workers are listed as not being in the workforce, but also do not count as being employed by some tracking metrics because they don’t have a third-party employer. This means there is a niche economy of individual workers who are providing for themselves, paying taxes, and feel like they are gainfully employed when the data shows they aren’t even working.
Unemployment From a Global Perspective
- In 2013, there were over 157 million unemployed workers in the world’s developing countries.
- East Asia has the largest number of unemployed workers at 39.4 million people in total, accounting for about 25% of the total unemployed.
- In East Asia, the official unemployment rate is just 4.5% when the total number of unemployed is divided by the total labor force.
- Sub-Saharan Africa has the second-most jobless people (27.2 million), followed by South Asia (26 million).
- Sub-Saharan Africa’s unemployment rate was 7.6% in 2013.
- North Africa and the Middle East had the highest regional unemployment rates in the developing world in 2013, at 12.2% and 10.9% respectively with more than 8 million unemployed workers each.
- The number of unemployed workers in the world from developing nations is equal to the popular of Bangaldesh.
- When all nations are considered, the total number of unemployed workers tops 200 million.
- While advanced economies account for about 15% of the world population, they account for 22% of global joblessness.
- 74.5 million of the workers globally who are unemployed are in the 15-24 age demographic.
- The global rate of youth unemployment is 13.1%, or about 3x higher than the worldwide unemployment rate for adults.
- The youth unemployment rates in North Africa and the Middle East are at 29.4% and 27.2% respectively.
- In 2013, there were an estimated 375 million workers in the world who earned less than $1.25 per day, accounting for 12% of the world’s employment, yet work for wages that do not exceed the threshold for absolute poverty.
- The world’s 375 million poorest workers outnumber the entire population of the United States by almost 60 million.
There are millions of people who are unemployed right now and want to have work. This data doesn’t even include workers who are under-employed or are working outside of their preferred career field because there aren’t any job opportunities available to them. Although the unemployment percentages may seem quite low, and for some demographics is quite low, the fact remains that many demographics are facing double-digit percentages of unemployment. In an economy that generates trillions of dollars annually around the world, evidence shows that it’s better to be an older White or older Asian worker because otherwise you’ll be bearing the brunt of the unemployment burden in the world today.
Although millions of people visit Brandon's blog each month, his path to success was not easy. Go here to read his incredible story, "From Disabled and $500k in Debt to a Pro Blogger with 5 Million Monthly Visitors." If you want to send Brandon a quick message, then visit his contact page here. Brandon is currently the CEO of Aided.