The CPG industry is focused on consumer-packaged goods. These are items that are usually intended to be used every day by consumers. They must be replaced frequently and be offered in a way that makes them easy to purchase and access.
Common examples of products offered by the CPG industry include food items, beverages, clothing, household items, and even items like tobacco.
Important CPG Industry Statistics
#1. The CPG industry is one of the largest industries in North America. It’s current average annual value exceeds $2 trillion. (Investopedia)
#2. Within the grocery segment, CPG sales are currently 45% of the market. (PWC)
#3. Small manufacturers have seen growth rates of 6.2% within the CPG industry since 2009. Private-label products have experienced a growth rate of 2.8%. Large manufacturers, with a value exceeding $3 billion, saw a growth rate of 1.6%. Medium manufacturers saw steep losses, contracting 3.7%. (PWC)
#4. The largest manufacturers saw a 43% share of the growth because of their overall volume. Small manufacturers saw an equal level of growth because of their innovative products offered within the CGP industry. (PWC)
#5. Since 1985, the CPG industry has outperformed the S&P 500 in comparative growth. The CPG industry saw a CAGR of 10%, while the S&P 500 saw a CAGR of 8.6%. (McKinsey)
#6. In the U.S. grocery channel, the number of SKUs offered to consumers has grown by 50% since 2010. (McKinesey)
#7. In 2014, consumer spending within the CPG industry from American consumers total $397.6 billion. By 2020, Americans may spend more than $420 billion for the first time. (Statista)
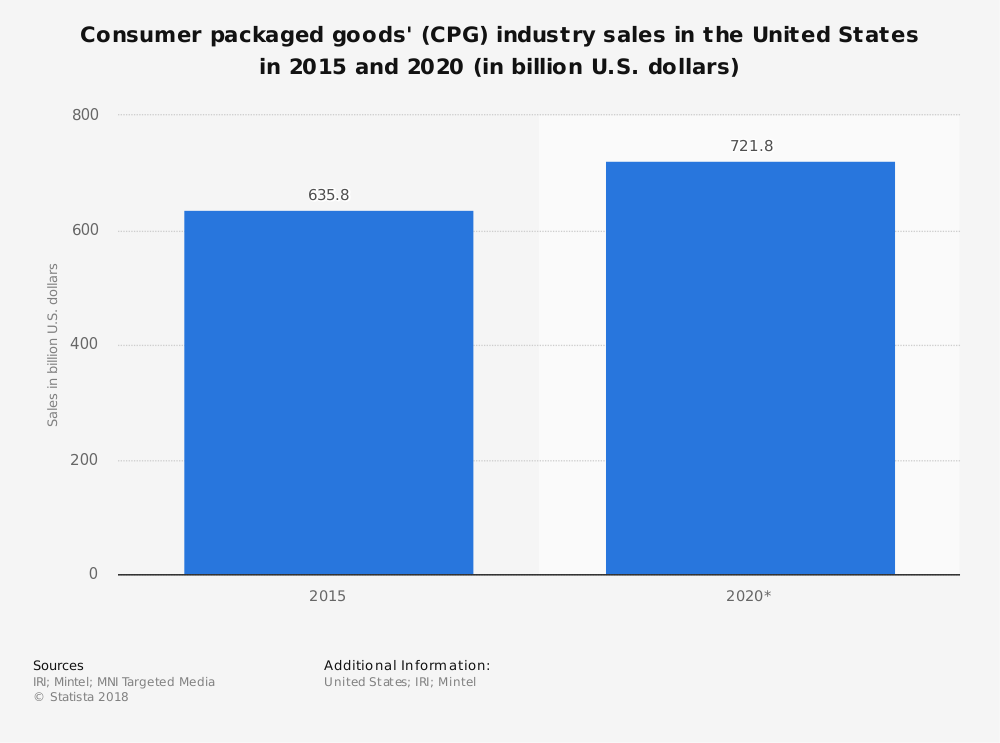
#8. CPG industry sales, in total, may top $720 billion by 2020. (Statista)
#9. The CPG item which showed the highest levels of growth for the industry in 2017 were private-label female contraceptives. Compared to the previous year, sales were 26,290% higher. (Statista)
#10. Fast-moving goods within the CPG industry created 23% of the world’s top brands by 2010. These companies were responsive for a total return to shareholders that averaged 15% per year for 45 years. The only other industry to outperform them was the materials industry. (McKinsey)
#11. Mass-market branding pays off when it comes to sales. Gross margins for branded items in the CPG industry have a margin that averages 25% more than non-branded items. (McKinsey)
#12. 75% of revenue growth within the CPG industry since 2007 occurred with brands that entered a developing market early and cultivated their categories to scale upward as consumer wages increased. (McKinsey)
#13. Efficient operational models that provide for cost reduction and consistency keep administrative costs within the industry to 4-6% of revenue for the average brand. (McKinsey)
#14. Millennials are 9% poorer than those in Generation X at the same age. That means they are willing to pay more for special things but seek out value purchases in other areas. They shop carefully and make specific choices about where, when, and why they purchase certain things. (McKinsey)
#15. More than 4,000 small consumer-goods companies have received a combined total of $9.8 billion in venture funding since 2007. 75% of the venture funding has come since 2013. This trend has helped to grow challenger brands within the CPG industry. (McKinsey)
#16. 18% of the recent industry growth found in the CPG industry is attributed to India, China, and Indonesia. Their share of the global CPG industry may reach 30% within the next 10-year forecast. (Deloitte)
#17. The e-commerce market for consumer-packaged goods is valued at $155 billion. This channel accounts for just 6% of the total sales which occur. Grocery stores make up the vast majority of sales within this channel. (Deloitte)
#18. 70% of consumers will reference user reviews as part of their shopping process for CPG items, even if they are not shopping online for them. Only 29% of shoppers choose to purchase items because of the presence of a loyalty program. (Deloitte)
#19. The number of private exits from the CPG industry has risen by more than 250% since 2011. In 2015, more than 160 private exits occurred within the industry. (Deloitte)
#20. In 2016, there were more than 1,300 mergers and acquisitions within the CPG industry. In 2006, there were only 27 M&A deals. (Deloitte)
#21. 50% of consumers say that they are needing to make sacrifices right now just to make ends meet. 45% of households say that their financial health is “strained.” 29% of homes currently struggle to have enough money available to purchase their needed groceries. (Consumer Connect)
#22. It’s not just the working poor who report that they are struggling to make ends meet. 23% of households earning $100,000 or more per year say they’re making sacrifices. 73% of homes making less than $35,000 per year say the same. (Consumer Connect)
#23. Baby Boomers are just as likely as Millennials, 55% each, to report that they are making sacrifices to make ends meet. (Consumer Connect)
#24. Millennials are more likely to make brand concessions (80%) than any other generation. Generation Xers are more likely to look for coupons, promo codes, and miscellaneous digital savings opportunities (56%). (Consumer Connect)
#25. 38% of consumers say that they are willing to pay more for products in the CPG industry which offer benefits that go beyond basic nutrition. (Consumer Connect)
#26. 22% of consumers say that they are willing to pay a premium price for items which include environmentally-friendly packaging. (Consumer Connect)
#27. For companies starting out in their first year of operations within the CPG industry, the median sales achieved are $11.4 million in the food/beverage category, $17.6 million for non-food items, and $21.9 million for convenience items. (IRI Market Advantage)
#28. In 2016, year-one companies earning less than $20 million for the year accounted for 67% of the sales distribution. That figure has nearly doubled, from the 37% of sales distribution at that revenue rate, from 2014. (IRI Market Advantage)
#29. 31% of the new products launched within the CPG industry in 2016 involved personal care items. 23% of new launches involved beauty care, while 18% of launches were for health care products. Flonase was one of the biggest success stories in the launch category, generating $317 million in its first year of being sold over-the-counter. (IRI Market Advantage)
#30. Proactive care is one of the most popular segments of the CPG industry today. 40% of consumer say that they shop for products within the industry based on how it helps them with their lifestyle. People in the 18-34 age demographic are the most likely to shop in this manner. (IRI Market Advantage)
#31. 57% of the food and beverage categories which introduced a healthier solution for consumers say their sales grow faster than the average achieved for their segment. (IRI Market Advantage)
#32. Refrigerated lunches saw a 12.6% increase in 2016 in dollar sales changes when compared to figures from the year before for shoppers focused on healthier eating. Frozen side dishes (11%), bottled water (8.1%), and ready-to-drink coffee and tea (7.9%) saw strong sales growth as well. (IRI Market Advantage)
#33. 52% of consumers say that their top priority for a new food product in the CPG industry is that it is fresh or not processed. This is more popular than a new product being low in sugar (44%), simple ingredients (42%), or providing appetite satisfaction (42%). (IRI Market Advantage)
#34. For consumers who are not restricting their eating preferences, appetite satisfaction is the top shopping priority, mentioned by 57% of consumers. Foods that are quick and easy to prepare (51%), have low prices (48%), and appeals to family members (41%) are also top priorities. (IRI Market Advantage)
#35. The top three factors for consumers when shopping for new food and beverage products are taste at 93%, price at 83%, and healthfulness at 70%. (IRI Market Advantage)
#36. Even though just 1 in 4 households around the world with internet access say that they’ve ordered groceries online, 55% of consumers with internet access say that they are interested in placing an online order in the future. (Nielsen)
#37. Americans spent about 5% less on their food and beverage purchases in 2015 within the CPG industry than they did in 1984. (U.S. Bureau of Labor Statistics)
#38. By 2028, women are expected to control 75% of all household spending. In 2013, 30% of wives were already earning more than their husbands. (Deloitte)
#39. In 2009, 28% of the world’s population could be classified as a middle-class earner. By 2030, that percentage could rise to 66%. (Deloitte)
#40. Youth is not just an American issue. It is a global issue for the CPG industry. 65% of the population in India is under the age of 35. 30% of India’s population belongs to Generation Z. (Deloitte)
#41. When considering a food or beverage purchase, 37% of consumers say that they will splurge about half the time on products. 26% say that they’ll make room for treats, even if they are on a restrictive diet. 8% of consumers say that they seek out items which will help them to relax. (IRI Market Advantage)
CPG Industry Trends and Analysis
The CPG industry is expecting 1 billion new customers by 2028. There will be a trend within the consumer base to look for products that are environmentally friendly. Shifting demographics will place an emphasis on value and cost, with a strong desire by consumers to seek out products with a health and wellness emphasis.
External factors will create stressors on the CPG industry which must be addressed. There has been a rising tide of protectionism occurring in recent years, both in politics and in trade. Threats of tariffs will raise uncertainty levels, if not consumer costs, even if a preference for domestically-produced goods is developed. Changing tax regimes will create more uncertainty about the final costs to consumer as well.
Issues within the emerging markets will also need to be addressed to stabilize the industry. Labor shortages will likely happen with greater frequency as better wages and working conditions are demanded. Higher wages there means higher prices for the consumer, which means input costs could become quite volatile.
With that much uncertainty, innovation will once again pave the way toward success. The brands which can withstand the challenges and offer targeted products will come out as a winner. These changes will likely produce as many winners as they do losers, however, which means there can be no complacency within this industry.
There must also be an emphasis on building a strong e-commerce brand for all industry participants. Large brands could see up to 150% growth for their CPG-related items with a strong e-commerce platform. For smaller companies, the presence of sales platforms and drag-and-drop website builders makes it easier to reach a global audience than ever before. Neither can afford to miss online customers if they wish to maximize the impact of their brand.
The bottom line is this: brands must be willing to change. Those that feel like they are in a comfortable position will be the ones most likely to find themselves out of business.
Although millions of people visit Brandon's blog each month, his path to success was not easy. Go here to read his incredible story, "From Disabled and $500k in Debt to a Pro Blogger with 5 Million Monthly Visitors." If you want to send Brandon a quick message, then visit his contact page here. Brandon is currently the CEO of Aided.