Over the past three decades in the United States, the shape of the beer industry has changed significantly. There were only 49 operating breweries in the U.S. in 1983. By the end of 2016, the industry had reached a total of more than 5,000 active firms for the first time in history. In 2017, over 1,600 new permits for brewery operations were issued to new businesses in the United States as well.
California is the primary state where the beer industry thrives in terms of the total number of active operations. There are over 1,100 different breweries operating in the state right now. That is more than double the number that are operating in Washington state, which sits in second with 499 facilities. Colorado, Michigan, New York, and Pennsylvania all have more than 400 permitted breweries as part of their census as well.
Since 2017, over 9% of the market volume for the beer industry has moved from the largest brewers and importers to smaller operations and craft makers. In 2007, Anheuser-Busch held a 48.3% market share in the United States for the industry. In 2017, their market share had fallen to 41.6%. At the same time, Constellation saw their market share rise from 5.4% to 8.9% for American consumers.
Essential Beer Industry Statistics
#1. The beer industry in the United States sold 207.4 million barrels of beer in 2017. That is the equivalent to roughly 3 billion cases when the product is divvied up into 24 twelve-ounce servings. (U.S. Department of Commerce)
#2. There were approximately 2 million barrels of hard cider shipped by the beer industry in 2017 as well, which is the equivalent to over 28 million cases. (National Beer Wholesalers Association)
#3. 83% of the beer that was consumed in the United States throughout 2017 was produced domestically. The remaining 17% was imported from over 100 different nations from around the world. (U.S. Department of Commerce)
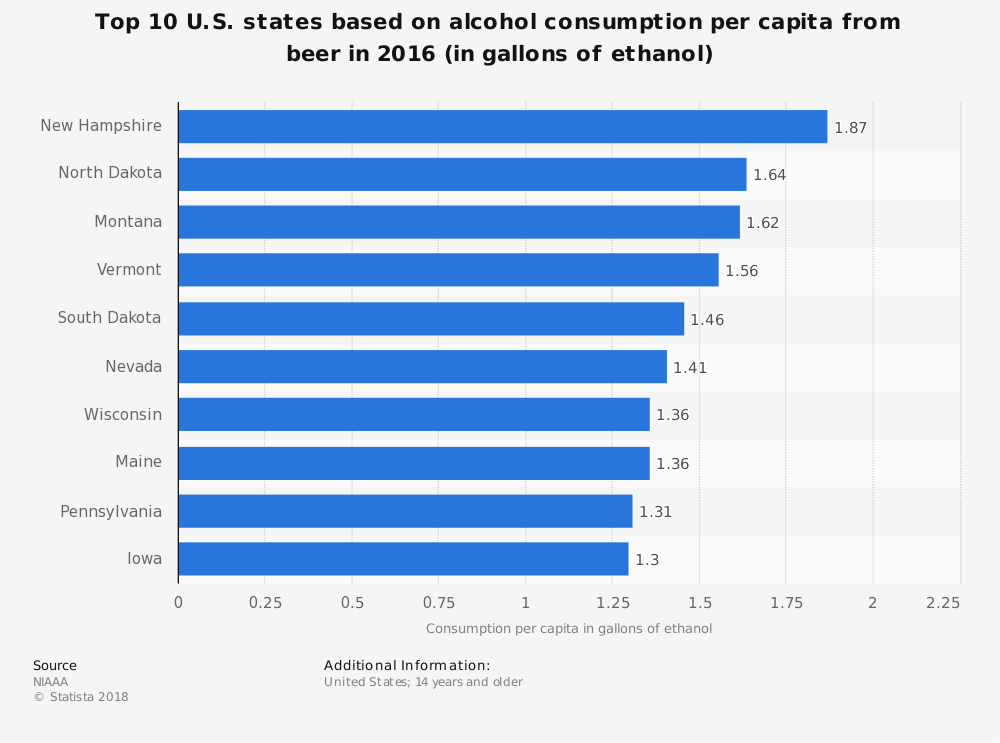
#4. The average person over the age of 21 in the United States consumed 26.9 gallons of beer and hard cider during 2017. (National Beer Wholesalers Association)
#5. There are approximately 240 million people in the United States that are of a legal drinking age, representing over 73% of the population. In 2006, this share was just 71%. (National Beer Wholesalers Association)
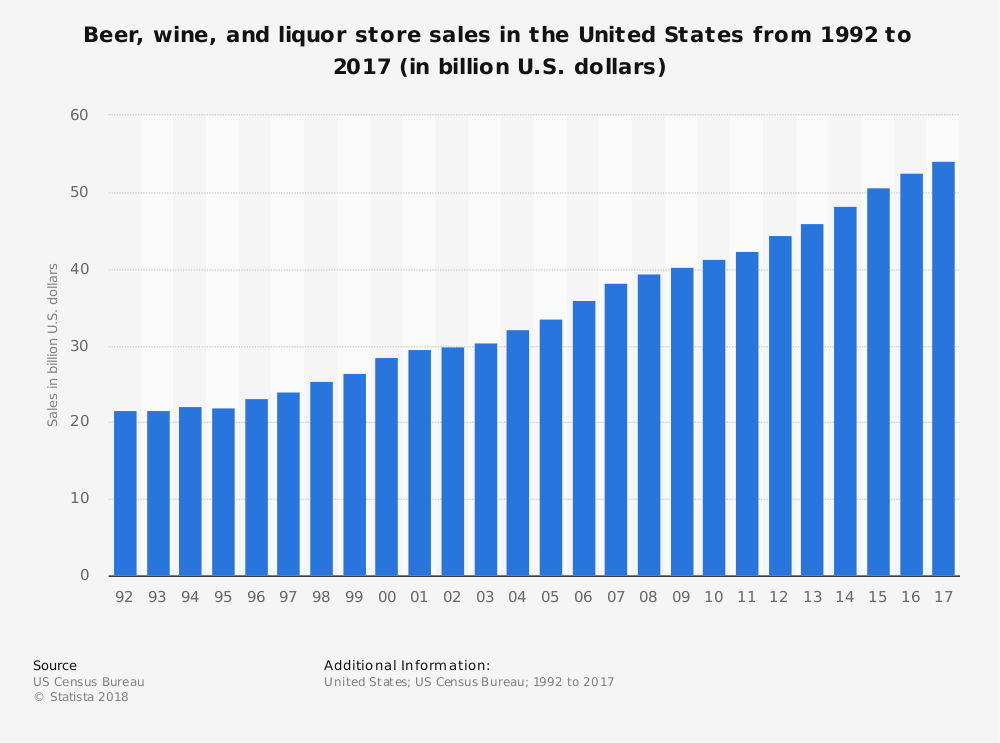
#6. Over $111 billion in malt-based beverages, including beer, is sent to American consumers every year. (Beer Institute)
#7. There are currently more than 5,600 reporting brewery locations or facilities operating in the United States. This figure is about 10% higher than it was in 2016. (Alcohol and Tobacco Tax and Trade Bureau)
#8. Roughly 25% of the breweries which are active in the United States are classified as brewpubs which only create beer for sales that are direct to the consumer on their premises. These facilities operate in most communities as a specialty restaurant. (Alcohol and Tobacco Tax and Trade Bureau)
#9. The average brewpub in the United States will create fewer than 1,000 barrels of beer each year, which is approximately 31,000 gallons. Some larger chains are beginning to produce more as franchising arrangements and community opportunities continue to expand. (Alcohol and Tobacco Tax and Trade Bureau)
#10. 95% of the breweries in the United States are making less than 465,000 gallons of beer each year. That figure represents an average of 15,000 barrels, accounting for less than 4% of the total volume that consumers drink annually. (Alcohol and Tobacco Tax and Trade Bureau)
#11. There are currently 15 breweries in the United States which are producing over 6 million barrels of beer each year. These facilities represent a 72.6% market share of the industry by volume. (Alcohol and Tobacco Tax and Trade Bureau)
#12. 36% of consumers say that they do not consume alcohol at any time. For those that do drink alcoholic beverages, beer is the preferred choice. In 2017, 40% of consumers said that they preferred beer. while 30% said that they preferred wine. Another 26% said they purchased spirits as their preference. (Gallup)
#13. The craft beer market in the United States has a current value of $26 billion on 8% sales growth. That figure represents a 12.7% share of the overall beer industry. (Brewers Association)
#14. 40% of the sales that the beer industry is able to achieve each year occurs during the months of summer. This figure includes domestic super premium, domestic premium, and on-premise channels for the industries. (Nielsen)
#15. About 8% of the annual sales which occur for the beer industry in the United States happen during the four-week around the Fourth of July holiday. Domestic premium beer sees an average of $648 million in sales during this time. (Nielsen)
#16. The breweries which are operating in the United States offer more than 450,000 job opportunities in the craft segment alone. That represents a $67.8 billion contribution to the American economy as of 2016, which reflects a growth rate of 21.7%. (Business Wire)
#17. Craft breweries in the United States donated over $73 million to charitable causes in 2016, which is up about $2 million from 2014 figures. (Business Wire)
#18. Over 1 million households in the United States say that they try to make at least one batch of beer every year. These homebrewers contribute about 1.4 million barrels of beer to the industry, which is about 1% of total American beer production. (Business Wire)
#19. Over 30% of the sales which are achieved by the beer industry in the United States each year occur in convenience stores. Grocery stores are another important channel for industry exposure. (Statista)
#20. Approximately 44% of the beer consumption in the United States is attributed to light beer products. Bud Light was the top-ranked brand for the industry in 2016, providing sales of about $2 billion. That figure represents a market share of more than 18% among domestic beer brands. (Statista)
#21. Although the beer industry in the United States is extensive, Americans are only the second-largest producer of this beverage in the world. China consistently produces over 440 billion hectoliters each year, which is twice as much as what U.S. producers can achieve. (Statista)
#22. 6% of adults in the United States say that they have at least one beer every day. (Statista)
#23. 26% of adults say that they will include beer as one of their beverage options when they are planning their Thanksgiving meal. (Statista)
#24. 21% of adults in the United States say that they usually drink beer (or wine) with one of their homecooked meals. (Statista)
#25. The most popular time to drink beer in the United States is during the Super Bowl when 55% of adults admit that they have at least one beverage during the game. (Statista)
#26. Over 4,000 different brewing companies have adopted the independent craft brewer seal in the United States, representing over 85% of the beverages which are currently available in local, regional, or national markets. (Brewers Association)
#27. 87% of adults who are above the age of 21 live within 10 miles of at least one brewery that is currently active in the beer industry today. (Brewers Association)
#28. 95% of the breweries which produced craft products say that they are reinvesting their tax savings from a re-calibrated excise tax on beer to hire new workers, purchase new equipment, increase benefits, or add to what they give to charity each year. (Brewers Association)
#29. There were 391 beer entries submitted in the 2018 Great American Beer Festival® under the juice or hazy IPA category, making it the most popular segment of the competition. (Brewers Association)
#30. 80% of the breweries which are in the top 50 in terms of beer volume produced for sale in 2017 were small or independent craft brewers. (Brewers Association)
#31. In 2016, 12 out of the top 16 new beer brands incorporated a flavor element to their product. Two of the top three products for the year were hard sodas with orange and ginger ale flavoring to them. New Belgium’s Citradelic Tangerine IPA was the first “traditional” beer product to make the list. (Draft Magazine)
#32. The top three new craft breweries in terms of total dollar sales and supermarkets are all from Texas. Austin Beer Works led the way in 2016 with over $610,000 in registered sales. Live Oak Brewing Company earned $338,000 in sales, while 8th Wonder Brewery earned $300,000. (Draft Magazine)
#33. Over 50% of the consumers who associate themselves with the beer industry say that they make their beverage purchasing decisions based on the quality of the product instead of the price at which it is offered. (Draft Magazine)
#34. Employment opportunities in breweries from 2010 to 2016 increased by 135% in the United States. The largest increase over to 12-month period occurred between 2015 and 2016 when job opportunities rose by 21%. (Bureau of Labor Statistics)
#35. California and Colorado lead the way in the United States for employment opportunities in the beer industry, offering 8,113 and 5,173 positions respectively. Indiana had the fastest employment growth, with 54 times the number of jobs available in 2016 compared to 2006 figures. (Bureau of Labor Statistics)
#36. The beer industry in the United States accounted for over 50% of the jobs gained in the beverage manufacturing segment of the economy between 2006 and 2016. (Bureau of Labor Statistics)
#37. One out of every four jobs that is available in the beverage manufacturing sector comes from brewery employment. (Bureau of Labor Statistics)
#38. Despite the increase in employment opportunities from the beer industry, the average weekly wage decreased by 25% from 2006 to 2016. That means the average worker went from earning $1,293 per week to only $969. (Bureau of Labor Statistics)
Beer Industry Trends and Analysis
The beer industry is one of the most stable beverage-related products which is produced in the world today. Because of its affordability and consistency as a beverage, consumers historically prefer it over any other type of alcohol-based product. Gallup Polls since 2001 have found that beer has been the leader in consumer preferences over wine and spirits.
The number of products which are available to consumers because of the beer industry is continuing to rise as well. In 1996, the average distributor within the industry was managing 190 unique products in their warehouses. As of 2016, that figure had risen to 1,025 unique SKUs.
Despite the increases in production and revenues, the beer industry has seen a shifted how products are distributed to consumers as well. In 1980, there were almost 4,600 traditional beer distributors operating across the United States. By 2017, that figure had dropped to approximately 3,000 firms.
Although beer sales saw a slight decline of 1% in 2017, there are segments of the industry which are exceeding expectations. Craft beer saw 5% increase to over 24.8 million barrels sold in the United States that year. Import beer saw 3.2% increase, while export craft beers off 3.6% increase. Consumers are moving away from mass-produced products to beverages which are crafted to meet individual preferences. As the industry adapts to this shift, we expect the next 5 years through 2024 to offer an annual average rate of growth between 2% to 3.5%.
Although millions of people visit Brandon's blog each month, his path to success was not easy. Go here to read his incredible story, "From Disabled and $500k in Debt to a Pro Blogger with 5 Million Monthly Visitors." If you want to send Brandon a quick message, then visit his contact page here. Brandon is currently the CEO of Aided.