It would be fair to say that the global footwear and apparel industry has seen better days. That’s not to say that sales or demand are off. Sales, in fact, rose worldwide for all apparel and footwear by 3.8% to a total of $1.67 trillion in 2016.
Although that seems impressive, that is also the weakest levels of growth for the industry since 2008. What has saved the industry from even lower sales is the athletic apparel industry. The growth of sales in the athletic and sportswear arena were more than double what the overall apparel industry was able to achieve.
Important Athletic Apparel Industry Statistics
#1. The sports and fitness clothing category is projected to reach sales of $231.7 billion by the year 2024. (Global Industry Analysts)
#2. The fastest rates of growth for the athletic apparel industry are expected from the APAC region, with an anticipated CAGR of 6.9% through the forecast period. (Global Industry Analysts)
#3. The performance sportswear category for the athletic apparel industry produced $78 billion in global sales in 2016. (Euromonitor)
#4. The categories with the fastest growth rate are sports-inspired apparel and footwear, which saw 6% and 10% growth levels respectively. (Euromonitor)
#5. In 2017, the total estimated value of the global athletic apparel industry was $168 billion. (Statista)
#6. The sale of sportswear, including active wear, Yoga pants, and similar products, was higher than any other category in 2016 for the third straight year. It was able to increase sales by just less than 7%. (Quartz Media)
#7. Even the strong figures of the past 3 years are off from sales seen in this sector from 2010-2013. As a name brand, Nike was able to generate a 12.3% increase in apparel sales, achieving consistent 4% growth levels, even in times of economic uncertainty. (Marketing Zeus)
#8. A transition in the athletic apparel industry has been underway since 2009. More shoppers, especially younger shoppers, are more likely to utilize videos for product research or shop online. 38% of people in the 18-34 age demographic used a video as a source for apparel research. Just 13% of people in the 35-54 age demographic and 16% in the 55+ age demographic did the same. (Marketing Zeus)
#9. Older shoppers are more likely to visit a store after viewing a product on video compared to younger shoppers. 32% of 55+ shoppers and 27% of 35-54 shoppers say that they visited a store because of a video they watched about a product. 38% of Millennials said the same thing. (Marketing Zeus)
#10. In the athletic apparel segment, 1 out of 4 video research attempts resulted in the purchase of apparel at least 6 times within the past 6 months. About 30% of shoppers spent more than $500 because of their research. (Marketing Zeus)
#11. The Middle East is expected to be the largest geographical sub-segment for the athletic apparel industry in terms of future growth. Some year-over-year sales have approached growth levels of 15%. (Sports Chump)
#12. Established markets have struggled to see any increases in sales for athletic apparel. In Europe, for example, recent years have averaged a growth rate of just 1%. Even in low-sales years in the U.S., growth rates have averaged around 4%. (Sports Chump)
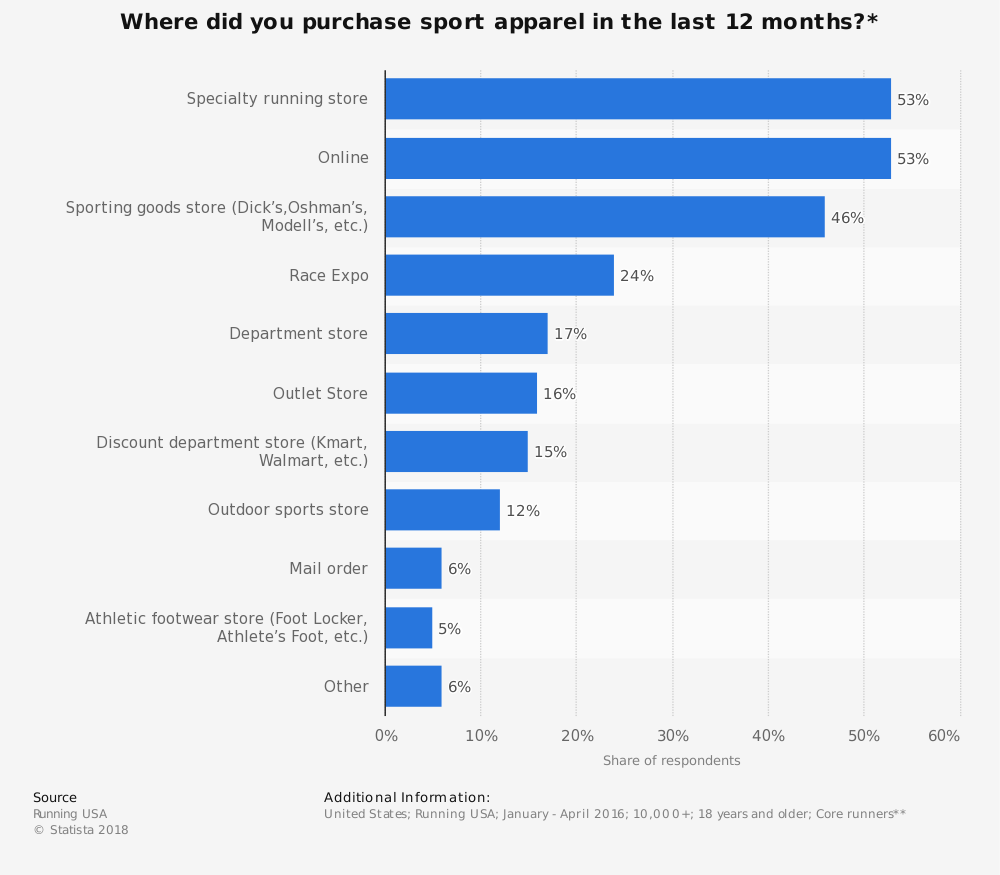
#13. About half of all shoppers who are looking for athletic apparel spot something that they want from research conducted on a mobile device. Although the device is mobile, most shopping through those devices occurs from home. (Sports Chump)
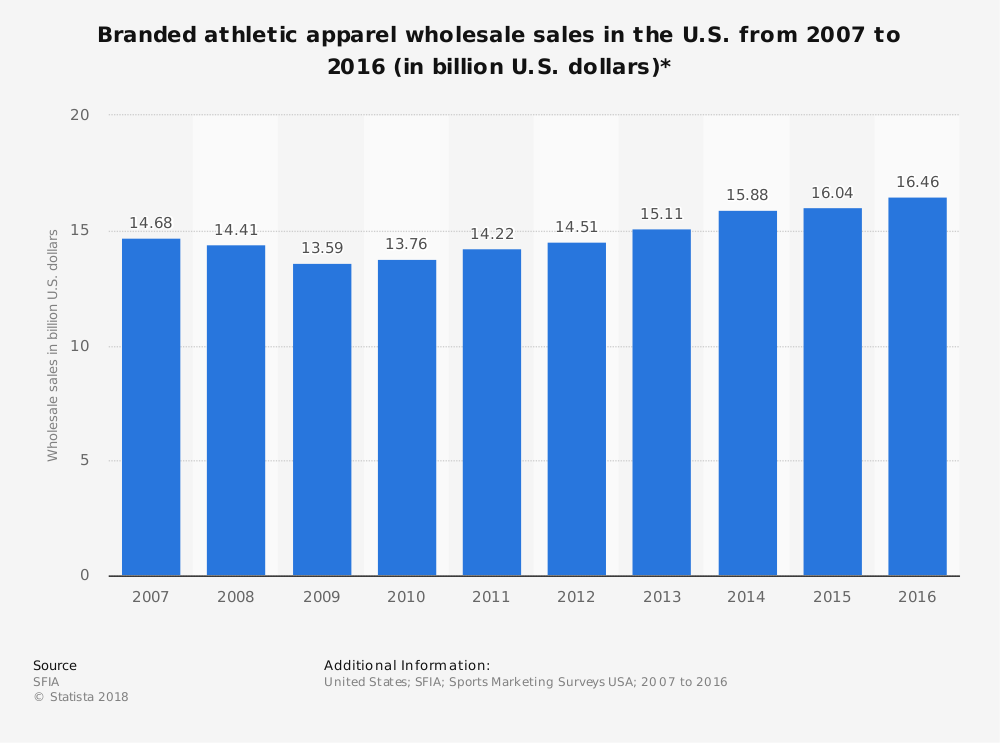
#14. In 2016, because of the bankruptcy of Sports Authority, apparel sales were down in the United States by 50%, achieving a 2% overall increase in the athletic segment. (Forbes)
#15. When separated, performance and fitness apparel saw a 2.9% increase in the U.S. in 2016, even though the athletic apparel segment as a whole grew by about 2%. (Forbes)
#16. In the United States, bottoms tend to generate more in overall fitness apparel sales than tops do. The sale of bottoms in 2016 was estimated to be about $242 million in revenues, while the sale of tops brought in about $200 million in revenues. (Forbes)
#17. Some athletic apparel categories in the U.S. saw declines instead of growth. Most were related to a specific sport. Football footwear, for example decreased by 2%, while golf apparel saw declines of 2.4% in 2016. (Forbes)
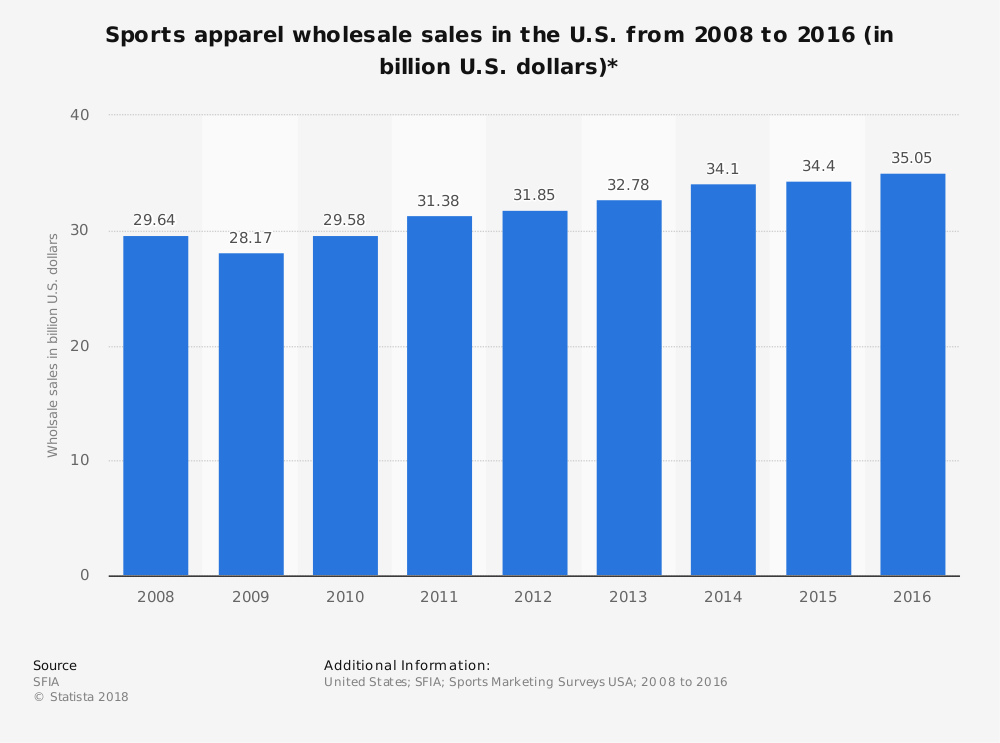
#18. Between 2009-2015, sports apparel and footwear sales jumped 42% in the United States, climbing to a total of $270 billion. (Morgan Stanley)
#19. From 2015-2020, up to $83 billion in sales are forecast to be added to the industry, which would equate to a growth rate of more than 30%. (Morgan Stanley)
#20. The sports that people choose to play shape the athletic apparel decisions households make. In North American high schools, the participation rates for women have almost double over the past 35 years. Similar trends in the athletic apparel segments follow those increases. (Morgan Stanley)
#21. Although growth rates have hovered around 1% in Europe, there are some forecasts that place a 5% annual growth being a possibility within the next 5 years. (Morgan Stanley)
#22. China may be the largest driver of future athletic apparel sales for the industry. The government currently plans to build up to 60% more sports facilities by 2025. The goal is to have 500 million people exercising more regularly and participating in community events. (Morgan Stanley)
#23. There is a direct connection between emotional wellbeing and an active lifestyle. For those earning less than $36,000 per year, having 3 days of exercise instead of 2 equates to a 6 percentage point jump in happiness. Similar jumps are seen in every income demographic. (Morgan Stanley)
#24. Under Armour has seen intense growth, doubling sales every three years since the company went public in 2005. Yet, when 2017 forecasts came out and sales were expected to climb 12%, the price of the stock took its largest fall in 9 years. (Quartz Media)
#25. The sports footwear industry is currently valued at $90 billion. (Fashion United)
#26. In total, the global apparel market is currently valued at $3 trillion. This makes it about 2% of the world’s overall GDP. (Fashion United)
#27. In the United States, there are about 1.8 million people who are employed in the fashion industry. About 232,000 of them are dedicated to the apparel industry. (Fashion United)
#28. The average salary range for an employee in the athletic apparel industry ranges from about $26,000 for an entry-level position to about $85,000 for sales and marketing positions. (Fashion United)
#29. About 80% of all U.S.-based employees are working for an apparel retailer. (Fashion United)
#30. Retail sales in U.S.-based sporting goods stores equal about $45 billion annually. These products include athletic apparel, footwear, licensed merchandise, and sometimes even exercise equipment. (Statista)
#31. The sporting goods industry produces about $88 billion in wholesale sales in the United States each year. (Statista)
#32. Nike is considered the most valuable sports-related business brand, with a current valuation that is just under $30 billion. In comparison, the brand value of Under Armour is just $5.86 billion. (Statista)
#33. Men generally make up a majority of the consumer base in the athletic apparel industry, accounting for 52% of the total market share. (Allied Market Research)
#34. Retail sales within the sports apparel segment of the industry are anticipated to grow at a CAGR of 3.1%. (Allied Market Research)
#35. According to a Nielsen report in 2013, women in the United States wield up to $15 trillion of purchasing power annually. Nike announced marketing expenditures of $804 million in the athletic apparel category for 2016, an increase of 10% from the year before, to focus on women’s products. (Business of Fashion)
#36. In FY2015, the women’s business for Nike surpassed $6.6 billion in sales and outpaced the growth levels in the men’s business. (Business of Fashion)
#37. The global health and wellness market is estimated at $732 billion. By 2021, it is forecast to reach $869 billion. Women are fueling the increase by focusing on wellness and self-transformation. (Business of Fashion)
Athletic Apparel Industry Trends and Analysis
The athletic apparel industry has shifted with consumer preferences, allowing it to maintain relatively consistent growth levels over the past decade. Consumers want apparel options that are comfortable, flexible, and stylish. It should work for the gym or for casual wear.
Mature markets are maintaining consistent sales levels for the industry, but the real potential for growth are the changing markets in the APAC region and the Middle East. As political climates change, and a growing middle class finds it has more discretionary spending funds to utilize, an emphasis on upgrading apparel occurs in many households. That is why such high CAGR levels are forecast.
The athletic apparel industry has a strong foundation. Strong enough that even major brands going through a bankruptcy cannot disrupt overall growth. As long as the industry continues to evolve as consumer preferences adapt and change, there is nothing that will hold this industry back from its consistent patterns of sales growth.
Although millions of people visit Brandon's blog each month, his path to success was not easy. Go here to read his incredible story, "From Disabled and $500k in Debt to a Pro Blogger with 5 Million Monthly Visitors." If you want to send Brandon a quick message, then visit his contact page here. Brandon is currently the CEO of Aided.