In 2016, many shipbuilders saw 20-year lows (or worse) for new orders. The global total for new orders that year were just 18.8 million gross tons. In comparison, new orders in 2007 were for 169.6 million gross tons.
Only 1,044 vessels were ordered during 2016. In the year before, there were 2,340 vessels ordered. In 2007, over 5,400 vessels were part of the global order book.
Although the global shipbuilding is working to recover from the lows experienced in 2016, some of the fallout is continuing. To book work, some builders are under-pricing their services to gain leverage in the market. Others have focused on providing one specific type of ship through their order book instead of a variety of vessels.
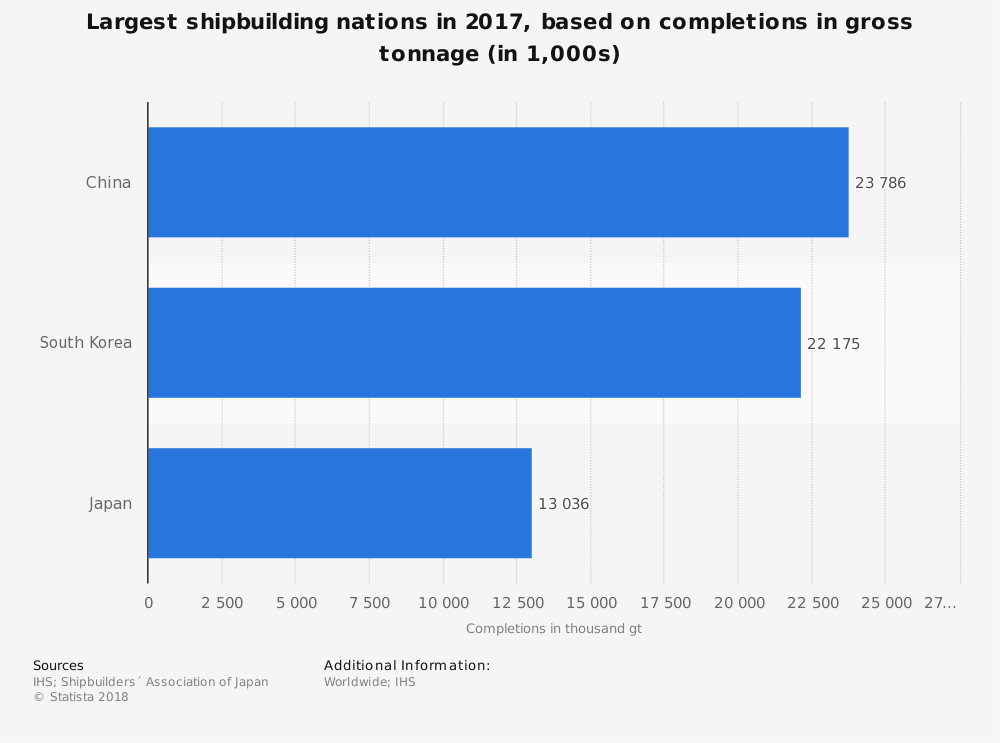
At the end of the day, China has emerged as the top shipbuilding nation in the world. In 2017, they ranked #1 in completion rate (41%), volume of new orders (42%), and holding orders (44%). Compared to their 2016 orders, the growth in 2017 for China was almost 30%.
Important Shipbuilding Industry Statistics
#1. South Korea was the largest shipbuilding nation in 2016 in terms of gross tonnage completion. Over 25 million gross tonnage was completed. China came in second, with 22.3 million gross tonnage. Japan was third, at 13.3 million gross tonnage. (Shipbuilders Association of Japan)
#2. The current global orderbook for shipbuilders stands at over 89 million CGT, with over 5,000 different vessels on order. (Shipyards and Maritime Equipment Association [SMEA])
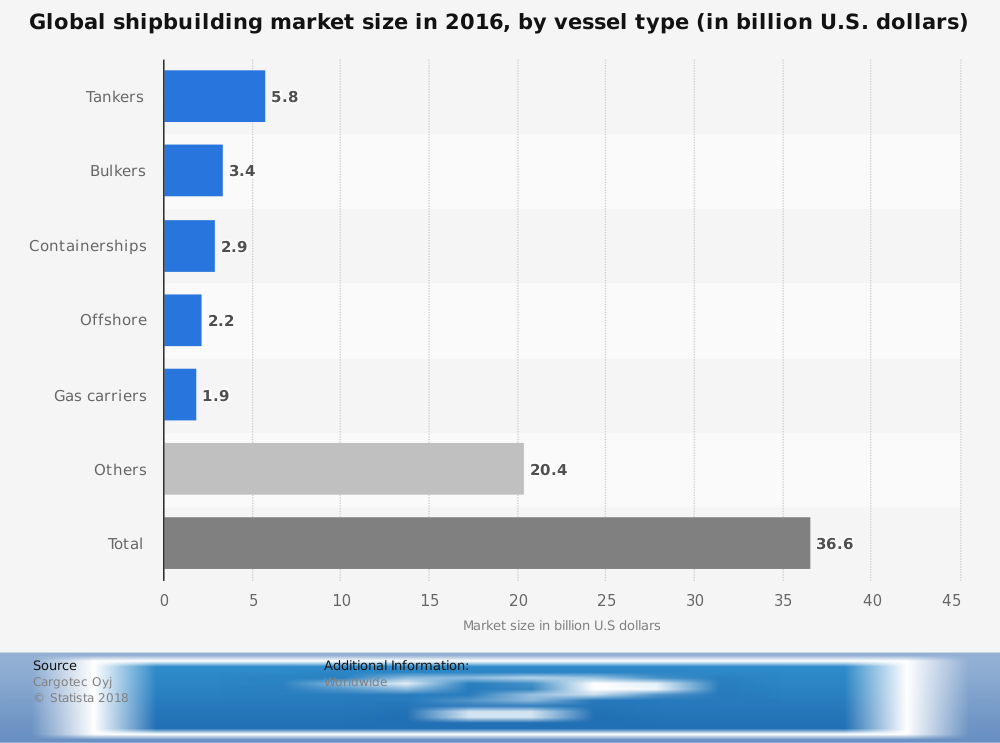
#3. In 2016, the number of new orders for cargo carriers dropped dramatically and was responsible for 80% of the overall decline of the shipbuilding industry to a 20-year low. (SMEA)
#4. 2.7 million CGT of shipbuilding orders are current placed at European facilities, which makes the region fourth in the total tonnage completed and second in the world for overall size. Europe was the only geographic segment of the industry which saw growth in 2016. (SMEA)
#5. Over 50% of the value in new shipbuilding orders since 2016 have been sent to Europe. Japan has received about 20% of the new orders which have come through. (SMEA)
#6. Although Europe is classified as its own region, Greece is responsible for about 10% of the world’s shipbuilding order book. About 500 new orders were added to the industry in 2014, with almost half of the new orders being for bulkers. (Eurobank)
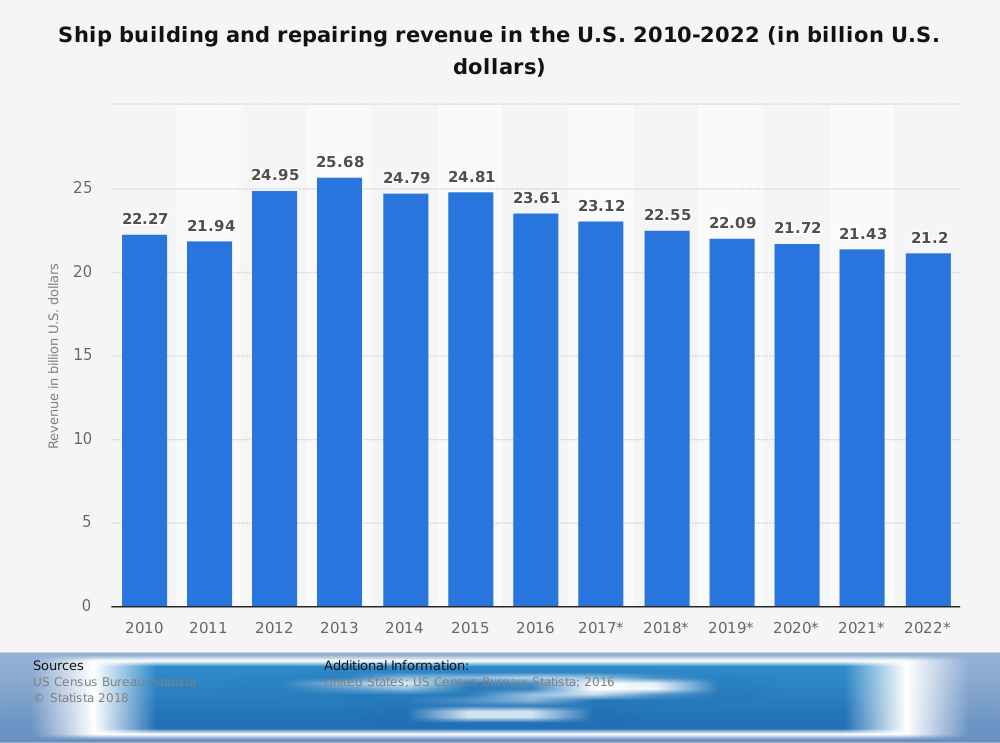
#7. Total export values from the U.S. shipbuilding industry reached more than $500 million in 2012. Exports in 2006 reached $800 million for the first time. (IBIS World)
#8. In 2018, only 7 significant vessels were delivered from Canadian shipyards, with the largest vessel being a 284-foot ferry. The industry delivered 4 fishing vessels, an 80-foot ATB tug, and a 77-foot ferry as well. (Transport Canada)
#9. The U.S. shipbuilding industry delivered 41 tugs and towboats in 2018, with the largest vessel being 1,437 gross tons. Another 26 passenger vessels were delivered, along with 5 large ocean-going barges and 9 deep-draft vessels or structures. (U.S. Coast Guard)
#10. U.S. shipbuilders also delivered 9 inland tank barges and 25 inland dry cargo barges as part of their overall orderbook work. (U.S. Coast Guard)
#11. Since 1987, the U.S. shipbuilding industry has delivered a total of 48,100 vessels. About 1,500 vessels per year are completed. 1997 was the most successful year for the industry, when over 2,500 vessels were delivered. (U.S. Coast Guard)
#12. Order volumes for mainstay merchant vessels in the Japanese shipbuilding industry rose by 150% in 2017, with bulk freighters and environmentally-friendly ships seeing recovery trends for the industry as well. (Nikkei Asian Review)
#13. Total orders in 2017 for the Japanese shipbuilding industry were 195 vessels, which totaled 9.45 million gross tons in capacity. That follows a historic low in 2016, when just 3.7 million gross tons were ordered. 156 of the 195 vessels were for bulk carriers. (Nikkei Asian Review)
#14. A record-breaking order for a container vessels was sent to the Chinese orderbook in 2018, which would hold 22,000 twenty-foot equivalent containers. The current record is 21,000 containers, which is held by the OOCL Hong Kong. (Hellenic Shipping News)
#15. China successfully delivered the first 33,000-ton smart ship that was approved by Lloyd’s Register of Shipping, along with a 38,000 cubic meter ethylene tanker. (Hellenic Shipping News)
#16. Although 2016 was a down year for new orders, it was relatively stable for completions. In 2016, there were 2,543 completions delivered, with a total gross tonnage of 66.4 million. Although there were 230 fewer vessels delivered compared to 2015 numbers, the gross tonnage was only 1 million less and higher than what was delivered in 2014. (IHS Markit)
#17. At the end of 2016, China held 1,794 orders in their orderbook at the end of the year. In comparison, Europe held 328. Since 2007, the number of vessels in the European order book has dropped by more than 70%. (IHS Markit)
#18. In 2016, there were over 113,000 ships operating in world merchant fleets. 34% of these ships were bulk carriers, while 20% of them were oil tankers. (IHS Markit)
#19. The number of oil tankers on world waterways has decreased by 4 percentage points since 2007, while the number of bulk carriers has increased by 6 percentage points at the same time. (IHS Markit)
#20. Over 800 more oil tankers are operational today compared to 2007. There are now over 8,100 operational oil tankers as part of the world merchant fleet. (IHS Markit)
#21. India leads the world in total shipping disposals, taking care of 325 vessels and 8.4 million gross tonnage. Bangladesh leads the world in total volume, serving 230 vessels and 9.8 million gross tons. (IHS Markit)
#22. About 1,000 ships are retired from the global merchant fleet each year. In 2012, a record 1,803 vessels were retired. (IHS Markit)
#23. In 1977, there were over 264,000 employees, including subcontractors, associated with the 23 largest companies and 51 largest yards. Those figures have now dropped to 16 companies, 34 yards, and only 56,000 employees. (IHS Markit)
#24. Shipbuilding in the United Kingdom is an industry which is valued at GBP 5 billion. Since 2014, the industry has experienced an average annualized growth rate of 5.1%. (IBIS World)
#25. Over 400 firms are part of the UK shipbuilding industry, providing direct employment opportunities for more than 24,000 employees. (IBIS World)
#26. The Clarksea Index is still hovering around $10,000 per day, which is well below the trend for the decade. This is despite the world industry cycle upturn that has produced 3.8% growth. (Clarkson Research)
#27. In 2018, the 3-month average tanker earnings were $12,000 per day, which is 46% below the 27-year average for the category. (Clarkson Research)
#28. The dry bulk market quarterly averages in 2018 are 40% below their 27-year average, at just $9,400 per day. (Clarkson Research)
#29. Orderbooks for container ships, bulk carriers, and tankers is now 9.6% of the total fleet size. For bulkers as their own category, the orderbook is 7.5% of the fleet, which is their lowest rate since 2002. (Clarkson Research)
#30. There are currently 26 states in the U.S. which have active shipyards. Although many are coastal states or in the Great Lakes region, states such as Missouri, Tennessee, and Kentucky have at least one active shipyard. (Shipbuilding History)
#31. At 1.8%, Maine holds the largest share of shipbuilding and repairing industry employment in the United States. They are followed by Mississippi (1.6%), Virginia (1.3%), Louisiana (1.1%), and Rhode Island (0.7%). (IndustriALL Global Union)
#32. Only 3 states in the U.S. (Louisiana, Mississippi, and Virginia) feature more than 10,000 private employment opportunities in the shipbuilding industry. Virginia features the most, with over 26,000 employment opportunities. (IndustriALL Global Union)
#33. Shipbuilding and repairing in the United States contributes $9.2 billion to the GDP each year. The routine maintenance and repairs of vessels contributes another $600 million to the GDP. (IndustriALL Global Union)
Shipbuilding Industry Trends and Analysis
The shipbuilding industry is a cyclical, mature industry that has been around for over 2,000 years. Although technologies have changed with each generation, the need to travel the world’s oceans has never disappeared. That means the market for building ships will continue to exist.
As aircraft shipping methods have increased, the shipping industry has focused on bulk shipping methods. This has led to an increase in container ship orders and bulk carriers. It has also led to a decrease in other vessel types.
This has led to geographical segmentation of the industry. In the Asia-Pacific region, for example, you’ll find a focus on container shipping. In North America, you’ll find a focus on ferries, tugs, military vessels, and towboats. Then in Europe, you’ll find a mix of mid-size shippers.
That segmentation has led to a shift in where orders are placed. Instead of each producer providing a one-size-fits-all solution, orders are now based on these geographic specialties.
Over time, this will lead to even more cycles in the shipbuilding industry. It will also lead to more stability in geographic revenues, which should help the industry as a whole.
Although millions of people visit Brandon's blog each month, his path to success was not easy. Go here to read his incredible story, "From Disabled and $500k in Debt to a Pro Blogger with 5 Million Monthly Visitors." If you want to send Brandon a quick message, then visit his contact page here. Brandon is currently the CEO of Aided.