Liquor Industry Statistics and Trends
According to the Distilled Spirits Council, the liquor industry has seen a 3% volume growth and 4.5% revenue growth in 2012 from prior years. The market share continues to grow in revenue at a rate of 34.3% with exports hitting a record high of $1.5 billion.
Liquor Market Statistics
A global rise in demand for American Whiskey has seen record high numbers for the last three consecutive years. This is due to the trade agreements between the United States and Columbia, Brazil, Korea, Panama, and Russia.
Sunday Sales Bans have decreased. 38 States now allow Sunday spirit sales bringing the industry an additional $260 million in revenue.
Spirits tastings are now allowed in 44 states. Only 17 states had spirits tastings legalized a decade ago.
Entering the Spirits Industry
The following video features several people from the spirits industry that discuss how to enter the marketplace and the benefits of working within the industry.
Market Share
Volume Share by Pricing
1. Value (less than $12 a bottle) – 38.1%
2. Premium ($12-$18 a bbotle) – 36%
3. High End ($18-$30 a bottle) – 18%
4. Super Premium ($30 or more a bottle) – 7.9%
Revenue by Category
1. Value – $4.1 Billion
2. Premium – $7.3 Billion
3. High End – $6.0 Billion
4. Super Premium – $3.9 Billion
Top 5 Export Markets
The revenue and percentage growth from a decade ago are outlined below for the top 5 export markets in the industry.
1. Canada – $196.2 million (212% growth)
2. Australia – $152.6 million (197% growth)
3. UK – $144 million (84% growth)
4. Germany – $109.6 million (78% growth)
5. France – $108.7 million (262% growth)
Liquor Advertising Expenditures
The following media types are used by the liquor industry for advertising.
1. TV – $192.4 million
2. Radio – $6.4 million
3. Magazine – $201.5 million
4.Newspaper – $14.3 million
5. Outdoor – $54.2 million
6. Internet/Social Media – $21.6 million
Consumer Trends
Top 10 Flavors
1. Orange
2. Cherry
3. Coffee
4. Peach
5. Apple
6. Chocolate
7. Raspberry
8. Lemon
9. Anise
10. Lime
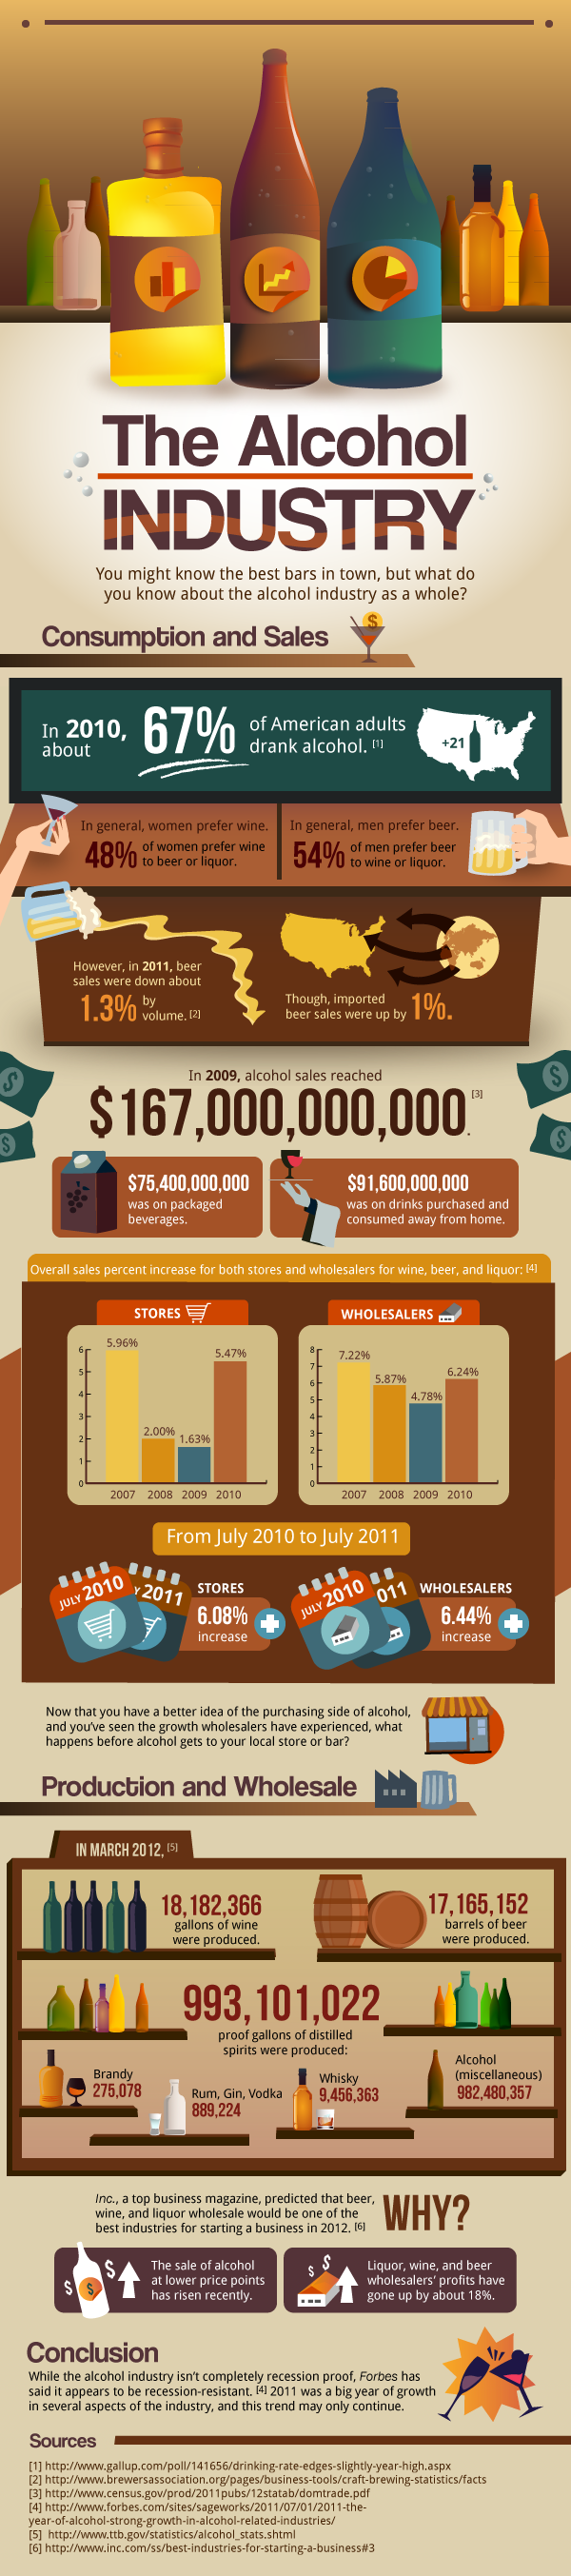
Alcohol Industry Consumption and Trends
Surveys indicate that approximately 67% of American adults drink alcohol. 48% of women prefer wine and 54% of men prefer wine or liquor. The below infographic outlines interest statistics on trends and consumption rates within the liquor industry.
Although millions of people visit Brandon's blog each month, his path to success was not easy. Go here to read his incredible story, "From Disabled and $500k in Debt to a Pro Blogger with 5 Million Monthly Visitors." If you want to send Brandon a quick message, then visit his contact page here. Brandon is currently the CEO of Aided.