There were 268 million registered vehicles on the roads in the United States in 2016. Those cars are involved in millions of crashes each year, resulting in over 34,000 fatalities and 2.2 million injuries to drivers and their passengers. Roughly 5 million car crashes involved property damage of some type.
The car insurance industry statistics show how important it is for drivers to carry a policy to protect their financial wellbeing in case something unexpected happens while on the road. A comprehensive product from an industry provider could help an individual cover their medical expenses, pay for property damage, or even replace their new vehicle if something happened to it for some reason.
Car insurance comes at a price that can be steep, depending on your age and what your driving record happens to be. The average cost of a policy for a 19-year-old in the U.S. in 2018 was $2,150 for men and $1,930 for women.
Important Car Insurance Industry Statistics
#1. The average expenditure for car insurance in the United States was $935 in 2016, which was an increase of 5.3% from the year before. (Insurance Information Institute)
#2. Consumers in New Jersey pay the highest average at more than $1,309 for the entire year. Louisiana follows in second with an average policy cost of $1,302, and then New York comes in third at $1,301. (Insurance Information Institute)
#3. The average cost to own and operate a 2018 vehicle was $8,849, while the average cost to insure a medium-sized sedan was $1,232. (AAA)
#4. Since 2007, the average cost to ensure a vehicle in the United States has risen by over $140 per year. (National Association of Insurance Commissioners)
#5. Iowa was the cheapest state in the U.S. for insuring a vehicle, with the average cost being just $628.10 per car in 2016. (Insurance Information Institute)
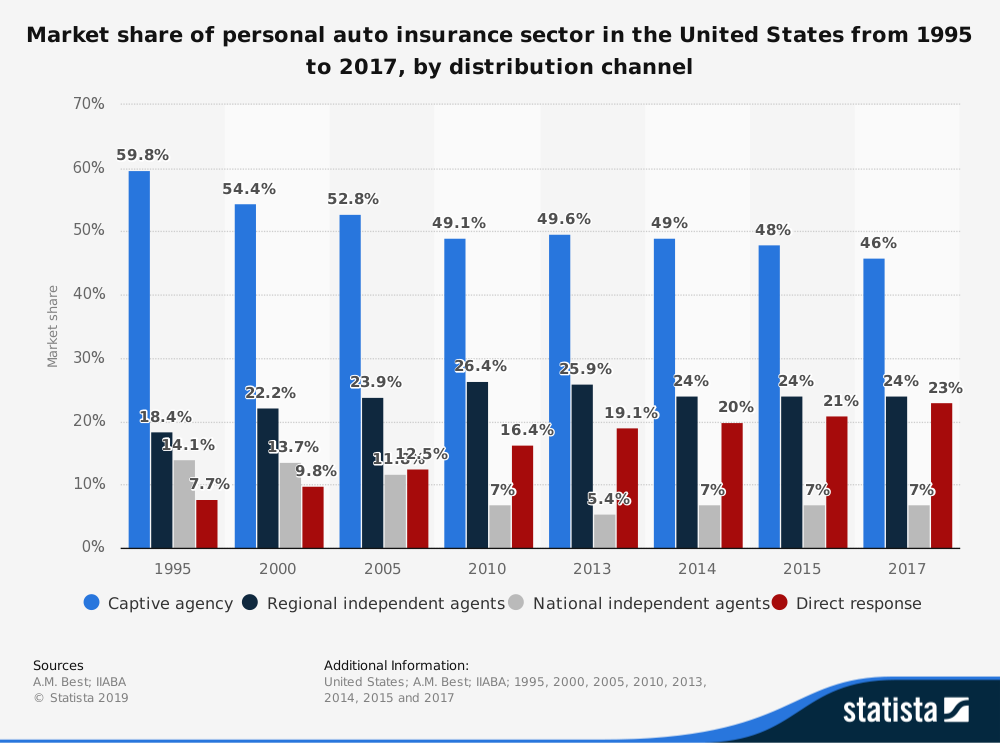
#6. Only 25% of consumers say that they trust the idea of peer-to-peer car insurance. Most people still prefer to work with an agency where they can receive personal care in some way. (Statista)
#7. There is a total of 6.06 million vehicle crashes that occur in the United States each year. These accidents cause 3.14 million injuries that a car insurance policy could cover. (Statista)
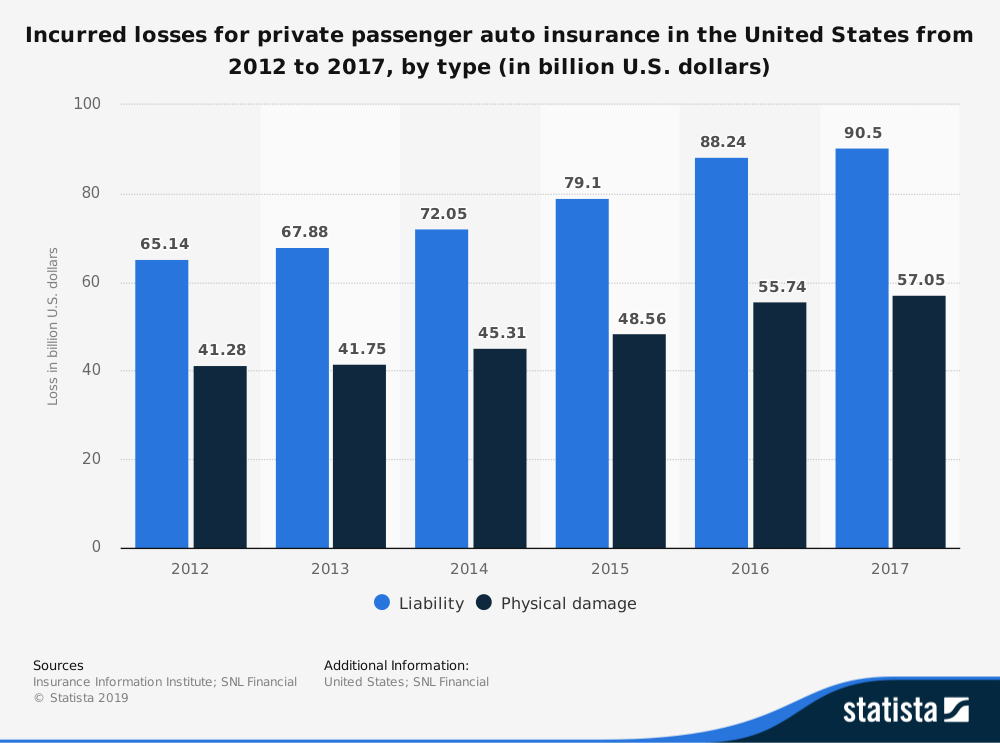
#8. Over $163 billion in incurred losses occur for the car insurance industry in the United States each year. (Statista)
#9. The average annual car insurance premium for a 16-year-old driver in the United States is over $8,200. (Statista)
#10. 35% of Americans say that they share data about their driving habits with their car insurance provider. Only 27% will comparison-shop for insurance products every few years as a way to save money. (Statista)
#11. 59% of Americans under the age of 35 say that they believe their ZIP Code affects their car insurance rates. (Statista)
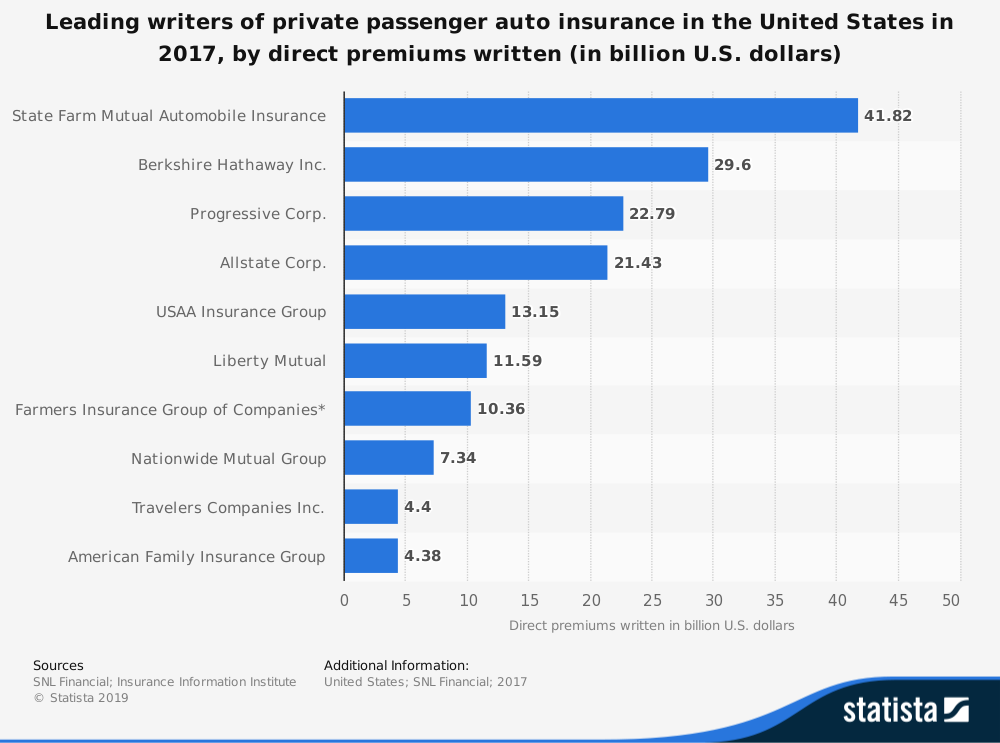
#12. State Farm Mutual wrote over $41 million in direct premiums in 2017, allowing them to take an 18% market share in the top spot in the American car insurance industry. Berkshire Hathaway holds a 12% share of the market with $29.5 million in direct premiums written. Progressive is third, writing $22.7 million in premiums and holding a 9.8% share. (National Association of Insurance Commissioners)
#13. In 2017, 1.1% of people with liability insurance had a bodily injury claim that they processed through their car policy. Another 4% who had this coverage processed a property damage claim. (National Association of Insurance Commissioners)
#14. 6.2% of collision insurance policyholders in the United States had a claim in 2017, while 2.9% of people with comprehensive coverage had a claim through their insurance provider. (National Association of Insurance Commissioners)
#15. The average automobile liability claim for property damage in 2017 was $3,638 in the United States. If a bodily injury claim was filed through a car policy, then the average amount was $15,270. (ISO)
#16. The average collision claim in the U.S. through an insurance policy was $3,425, while the median comprehensive claim was $1,817. (ISO)
#17. Drivers in the United States put on 3.14 trillion miles in 2015. That was a 3.5% increase over the year before and the largest change in the statistic in the past 25 years. (U.S. Department of Transportation)
#18. Between 2000-2014, the number of traffic deaths on American roads decreased by 22%. Figures from 2015 show that there was a 7.7% increase thanks to an increase in the levels of accident severity that occur. (National Transportation Safety Board)
#19. Since 2005, the average cost of a bodily injury claim has risen by more than 32%. Even with the added safety features that are in vehicles day, the cost of claims rises because of the inclusion of new technologies in the modern vehicle. (Insurance Research Council)
#20. 87% of drivers on American roads engage in some type of risky behavior when they are behind the wheel. 70% admit that they talk on their cell phone while driving. Another 42% said that they read the emails or texts when they are on the road. (AAA)
#21. Colorado saw the highest rates of car insurance policy cost increases in the United States in 2018. Drivers are paying 19% more than they did in 2017 for industry products. Montana saw the steepest decrease in costs at 21%. (The Zebra)
#22. Car insurance rates rose in 41 states in the past year. The most expensive brand to insure is Mitsubishi, where the average cost is 8% of the MSRP. Volvo is the cheapest manufacturer to insure, with a median rate of 4% of the MSRP. (The Zebra)
#23. The cheapest vehicle to insure in the United States is a Ford F-Series truck, with the typical policy being just 3.95% of its MSRP. (The Zebra)
#24. A DUI will raise your car insurance rates by over $1,000 per year in the United States, making it the most expensive ticket you can get as a driver. An at-fault collision will raise your rates an average of $617 per year. Even a speeding ticket will boost your policy cost by $341. Most driving violations will affect your insurance rates for 36 months after they occur. (The Zebra)
#25. If your car insurance rates are expensive, then getting married is one way to save some money. Couples who insured together can save up to 15% in some states in the U.S. each year. (The Zebra)
#26. Increasing your credit score by one tier is enough to drop your car insurance rates by 17%. If you choose our used car over a new one, then you can save 12% on your policy. Raising your deductible from $500 to $1000 can save an additional 11% as well. (The Zebra)
#27. There are more than 400 insurance companies who are active in the United States right now. (The Zebra)
#28. Most students who are under the age of 20 can obtain a car insurance discount of up to 25% if they are able to maintain a 3.0 GPA with their studies. (RMIIA)
#29. Drivers who spend at least 50 hours training in a formal setting, such as a school or paid instructional class, can save up to 10% on the cost of their car insurance. (RMIIA)
#30. Net premiums in the United States for car insurance policies have been over $1 trillion since 2015. (RMIIA)
#31. 91% of drivers and passengers say that they regularly use their seatbelt in states where primary seatbelt laws exist. The nationwide use of this safety device in the U.S. is 87%. (Insurance Information Institute)
Car Insurance Industry Trends and Analysis
Every market in the United States offers a special system to guarantee that car insurance is available to those who are unable to obtain it in the private market. Each system is given an assigned risk plan, which is why there are various differences in the amount that is charged for policy.
Because most countries require that you carry automobile insurance as a driver, this industry will continue to exist for the foreseeable future. Although some years are better than others in terms of revenue and profit, the structure of the policies ensures that providers are able to meet government regulations and expectations while creating a margin for themselves. Short-term forecasts expect to see revenue gains in the 3%-5% range.
The long-term forecasts are more concerning for the car insurance industry. With the rise of autonomous vehicles and self-driving features, changes to the industry could cause interest in a policy to drop by over 70%. More people may choose to use public transportation in the future as well as a shift toward urban living continues, further reducing the need for industry products.
People are driving more now, but technologies could change this by 2030. Until we know for certain what is possible in the automotive industry, it will be challenging to predict how the car insurance providers will react.
Although millions of people visit Brandon's blog each month, his path to success was not easy. Go here to read his incredible story, "From Disabled and $500k in Debt to a Pro Blogger with 5 Million Monthly Visitors." If you want to send Brandon a quick message, then visit his contact page here. Brandon is currently the CEO of Aided.