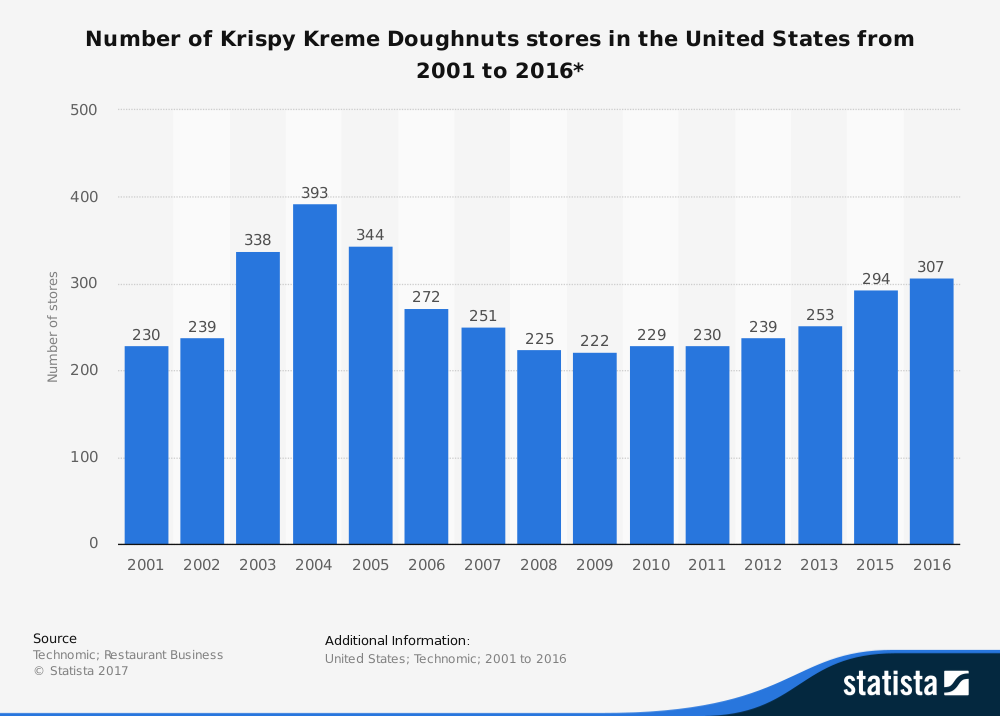
Specialty eateries have been increasing in every segment to their non-specialty counterpart as consumers become more aware of their options, quality, and service. According to the Specialty Food Association, total unit sales for specialty foods have increased 13.1%. An estimated 78% of specialty food sales occur at retail, making growth in this industry stronger than in foodservice industries. Several major brands operate in this space, including Starbucks, Krispy Kreme, Dunkin’ Brands, and Focus Brands, which includes Cinnabon and Auntie Anne’s.
Important Specialty Eateries Industry Statistics
#1. The U.S. specialty eateries industry includes about 60,000 establishments. This includes single-location businesses and franchises or branches of multi-location corporations. (Dun and Bradstreet)
#2. In the United States, the combined annual revenues of specialty eateries are about $31 billion. In comparison, the worldwide food service industry, of which specialty eateries are apart, averages about $3 trillion per year. (Dun and Bradstreet)
#3. Demand in the specialty eateries industry is driven by three primary components: demographics, household income levels, and consumer preferences. (Dun and Bradstreet)
#4. Profitability within this industry is dependent upon high-volume sales that are supported by operational practices that are highly efficient. That is why large companies tend to have an advantage over small single-location businesses, as they can leverage their size to improve cost margins. (Dun and Bradstreet)
#5. The top 50 companies in the specialty eateries industry within the United States account for about 45% of the total revenues it takes in each year. (Dun and Bradstreet)
#6. While food sales at retail grew by 2.3% in 2016, the specialty foods industry grew by 13.1%. (Specialty Food Industry)
#7. Dollar sales for the specialty food industry hit $127 billion for the first time ever in 2017, which was a 15% increase in total sales compared to 2014-2016. (Specialty Food Industry)
#8. Although growth is slowing down in the specialty eateries sector at physical locations, online purchases of products is increasing. In 2016, growth at retail and food service locations were 5.5%, compared to 9.1% the year before. (Specialty Food Industry)
#9. 78% of sales within the industry happen at the retail level. 11% of the total market is attributed to specialty retailers. (Specialty Food Industry)
#10. Specialty beverages within this industry are growing faster than any other category. On their own, beverages accounting for $10.5 billion in 2016, which was about 18% of the total industry space. (Specialty Food Industry)
#11. The snacking segment within the specialty food industry comprises 28% of the total market. There are 13 primary categories of specialty snacks and about half of them experienced growth levels of over 20%. Meat snacks saw the highest levels of growth, helping sales to reach $16.3 billion. (Specialty Food Industry)
#12. The net profits for manufacturers within the specialty eateries industry have risen by 18%, despite the fact that there are higher costs for production, ingredient acquisition, and certification compared to a decade ago. (Specialty Food Industry)
#13. 70% of distributors within the specialty eateries industry plan to expand their total product counts in the following year. (Specialty Food Industry)
#14. The impact of coffee on the U.S. economy in 2015 was $225 billion, which was about 1.6% of the national GDP. Consumers spent almost $20 billion at U.S.-based coffee shops in 2015. (SCA News)
#15. In a consumer survey, 94% of respondents state that they visit coffee shops on a regular basis. They visit the shops to purchase coffee bags for home brewing and specialty baked items in addition to a coffee beverage. (SCA News)
#16. The total number of specialty coffee shops located in the United States is believed to be more than 31,000. (SCA News)
#17. 25% of the specialty eateries industry involves businesses which have one shop location. 3 out of 4 businesses in this space, including brands that are found in a single community, have multiple shops. (SCA News)
#18. About half of the shops in the specialty eateries industry say that they plan to keep their number of locations the same in the coming years. 45% of businesses say that they plan to open at least one new location in the near future. (SCA News)
#19. Just 1% of specialty coffee shops say that they plan to contract their business footprint or have plans to file bankruptcy or go out of business for good. (SCA News)
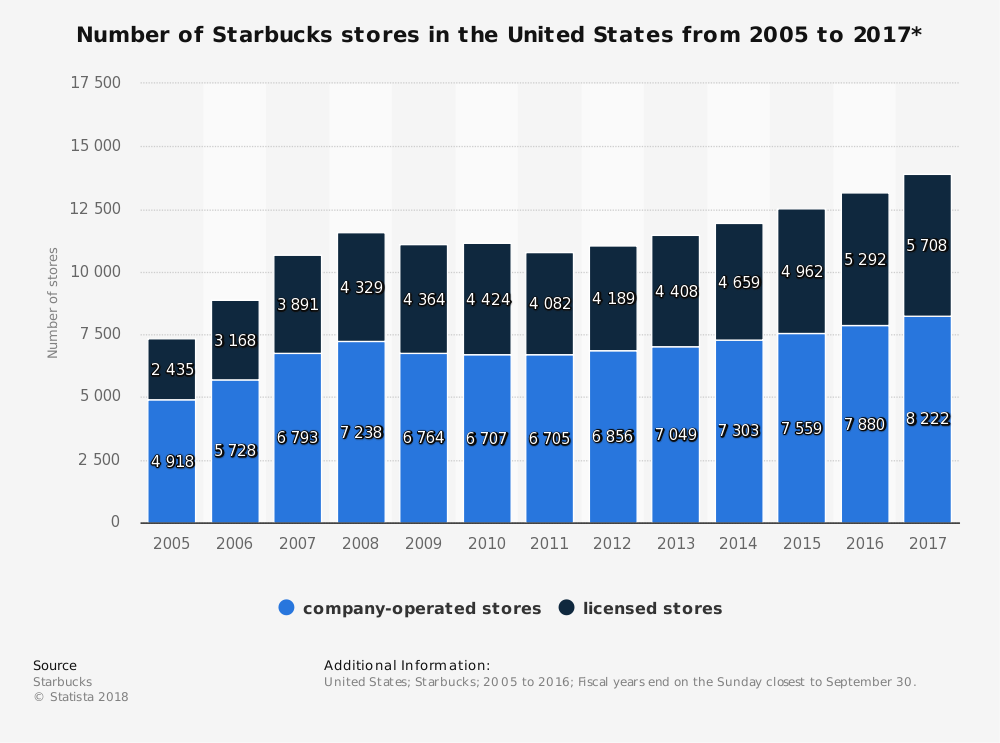
#20. Despite the size of certain brands in this industry, such as Starbucks or Dunkin’ Brands, no one company is expected to account for more than a 5% share of the overall industry on a national or global scale. (IBIS World)
#21. In the United States, more than 130,000 people are currently employed in the specialty eateries industry. Annual growth rates are expected to be similar to the 2.5% annual growth rate experienced from 2012-2017. (IBIS World)
#22. Despite the presence of specialty eateries, in the United States, most consumers purchase the specialty foods they prefer at a mainstream store. (Statista)
#23. Outside of beverages, the largest category in terms of sales for specialty foods in the U.S. is cheese and cheese alternatives. Over $4.3 billion in product was purchased by consumers in 2015 in a total market value of over $120 billion. (Statista)
#24. Key purchase factors for the industry include high-quality ingredients, new products to try, new flavors for exciting products, and a personal desire to try something new. (Statista)
#25. The four small-cap organizations with the highest operating margins in this industry currently are Papa Murphy’s, Falnigan’s Enterprises, Potbelly Corporation, and Shake Shack. (Benzinga)
#26. The four organizations with the highest return on assets in the specialty eateries industry are Panera Bread, Papa John’s, Starbucks, and Flanigan’s. Panera’s ROA was 15.9%, compared to Starbucks, which had an ROA of 7.5%. (Benzinga)
Specialty Eateries Industry Trends and Analysis
Although the specialty eateries industry is somewhat small compared to the over retail food industry, there are impressive levels of growth to be found. Millennials prefer specialty shops and almost always purchase at least one specialty item when they visit a location. Other generations frequent this industry as well with similar tastes and preferences, which means continued growth is likely.
The one threat to this industry is the expanding online space for specialty foods. If consumers can bypass local businesses by purchasing their preferred specialty items on their own, then the full growth potential of this industry may not be realized.
There is also a growing threat from specialty grocery stores and other natural food outlets. Even regular supermarkets are catering to the specialty trends that are seen on local levels. That means the success of each brand, no matter their size, will be dependent upon how well they innovate and the variety of products that can be offered to their customer base.
Although millions of people visit Brandon's blog each month, his path to success was not easy. Go here to read his incredible story, "From Disabled and $500k in Debt to a Pro Blogger with 5 Million Monthly Visitors." If you want to send Brandon a quick message, then visit his contact page here. Brandon is currently the CEO of Aided.