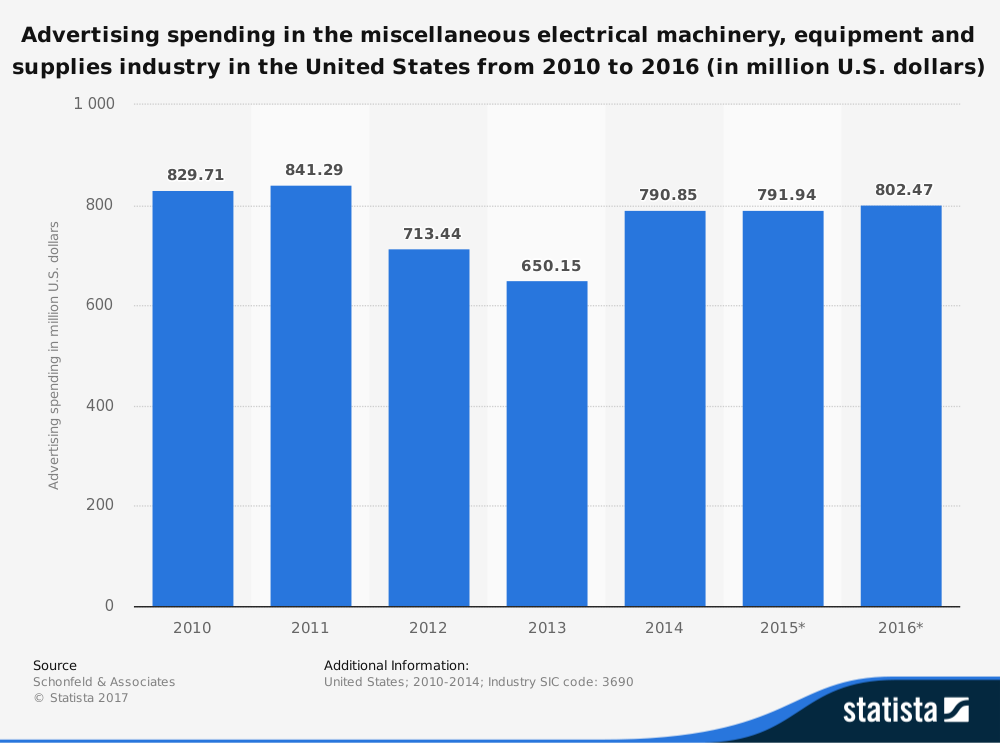
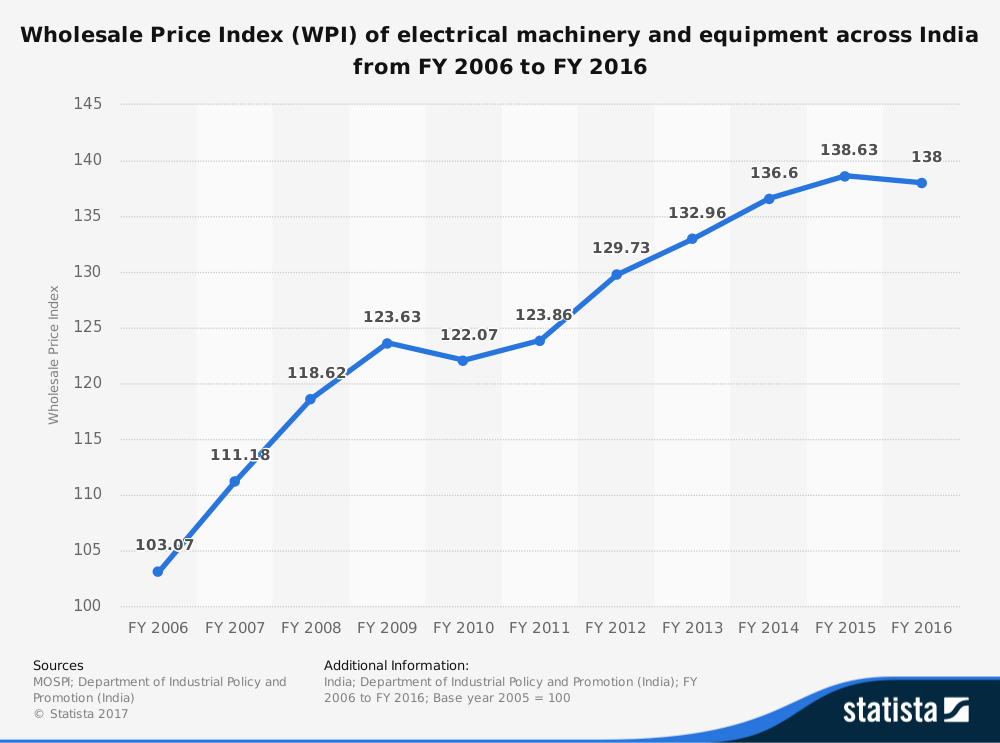
The heavy electrical industry covers power generation, distribution, transmission, and utilization. Products manufactured and installed by the industry may include transformers, turbines, boilers, and generators. The global manufacturing market is expected to rise to $3 trillion by 2020. The largest market region is found in Asia Pacific with China has the top country. India is expected to grow at a steady 16.8% rate.
Important Heavy Electrical Industry Statistics
#1. The value of the heavy electrical industry in the United States was estimated to be $40 billion in 2017. (IBIS World)
#2. Increased international competition from India and China is forcing a global contraction in annual growth for mature markets within the heavy electrical industry. In the U.S., the industry is forecast to annually contract by 0.7% each year through 2022. (IBIS World)

#3. About 2,100 business currently operate within the U.S.-based heavy electrical industry. In total, these businesses are responsible for the direct employment of over 115,000 individuals. (IBIS World)
#4. In 2010 figures (the last available global figures), the total value of the heavy electrical industry was $95 billion. (MarketLine)
#5. The largest segment of the heavy electrical industry from a global perspective is wind turbine production. This segment accounted for 42% of total revenues for the industry, or about $40 billion. (MarketLine)
#6. Revenues earned by the U.S. electric industry reached a peak of $393.06 billion in 2014. In 2016, total revenues equaled $386.51 billion. In 1970, the total revenues from the U.S. electric industry were just $23.7 billion. (Statista)
#7. The demand for electricity in the United States is forecast to increase by 26% from current levels through 2030. There is a forecast 38% increase from the commercial sector over this same period. (U.S. Department of Energy)
#8. In the overall electrical and power equipment industry market, motors and generators are responsible for one-third of the total shipments. In 2010, total shipment values were $34.6 billion. (IBIS World)
#9. Revenues have been relatively stable for the overall electrical and power equipment industry since 2001, though a decline of $9 billion was experienced between 2008-2009. (IBIS World)
#10. Data centers in the United States consume about 1.5% of the total electricity generated by heavy equipment, resulting in revenues of $4.5 billion annually. (Western Reserve Partners LLC)

#11. One of the biggest sectors for growth in the heavy electrical industry is “green” data centers, which have a forecast CAGR of 29%. Expenditures in this area in the United States already exceed $1 billion. (Western Reserve Partners LLC)
#12. The global market for turbine generator sets and turbines is expected to exceed 170,000 megawatts of new capacity additions in the next 5-year forecast period. (Western Reserve Partners LLC)
#13. Energy consumption is heavily reliant on the health of economies in the developed world. During the 2007-2009 recession that affected global markets, energy demands decreased in developed nations by an average of 6%. (Western Reserve Partners LLC)
#14. The American Recovery and Reinvestment Act of 2009 included heavy electrical stimulus, including more than $11 billion for smart grid investments. (Western Reserve Partners LLC)
#15. OEMs (original equipment manufacturers) are moving their product development and design requirements overseas. They are taking advantage of the growth being experienced in China and India in this industry. More than $150 billion in design services is expected to be outsourced by 2020. (MarketResearch)
#16. The global electronics and electrical manufacturing markets, when combined, could provide up to $3 trillion worth of opportunities for the heavy electrical industry to tap into. (MarketResearch)
#17. More than 1.2 million industrial robots are expected to be deployed by 2025 within the heavy electrical industry. (Boston Consulting Group)
#18. The global transformer market is expected to reach a total value of $35.3 billion by 2022. From 2016-2022, a CAGR of 7.07% for this segment of the industry is anticipated. (Allied Market Research)
#19. Low-power transformers are the largest segment of the power transformer market. Transformers that offer a rating of 100-500 MVA make up over 69% of the total market. (Allied Market Research)
#20. 42% of the market share for power transformers is generated through expansion efforts. Another 21% of the market comes from joint ventures. Just 12% of the industry is based on new product launches. (Allied Market Research)
#21. In 2013, an estimated 11,300 units were manufactured in the power transformer segment of the heavy electrical industry. (Grandview Research)
#22. The average age of an installed large power transformer in the United States is about 40 years old. 70% of the large power transformers currently operational in the U.S. are more than 25 years old. (U.S. Department of Energy)
#23. In 2010, there were 6 power transformer manufacturing facilities located in the United States. Their efforts, when combined, met just 15% of the power demand generating from within the U.S. (U.S. Department of Energy)
#24. The total value of large power transformers imported to the United States has increased by 188% from 2005-2011. The total value of these transformers was $817 million in the final year reported. (U.S. Department of Energy)
#25. In 2010, the lead time from a customer order for a large power transformer ranged from 5-12 months, depending upon the domestic manufacturer. International manufacturers required a lead time of up to 16 months. In extreme instances, a lead time of 5 years is required if new engineering is required for the product. (U.S. Department of Energy)
#26. The cost of raw materials is significant within the heavy electrical industry. The typical transformer, for example, may have up to 67% of its total cost in raw materials, with 24% dedicated to steel and 27% dedicated to copper. (U.S. Department of Energy)
#27. In 2007, there were 2.1 million tons of installed electrical steel available to the heavy electrical industry. Viz Stal in Russia led the way with 17% of the market. AK Steel in the US had a 15% market share. (U.S. Department of Energy)
Heavy Electrical Industry Trends and Analysis
As the push to develop more renewable energy resources continues, the heavy electrical industry will continue to see a surge in orders. This surge will create a demand for higher productivity and efficiency levels. In many industries, this would translate to more jobs. For this industry, it has created a demand for better automation.
That doesn’t mean indirect employment opportunities will disappear. Workers will be needed to install transformers and turbines, then maintain them. Research and design will still be part of the process as well.
What we will see is that a majority of the job growth within the heavy electrical industry will likely be in India and China over the next 10 years. Labor costs are fractional in the developing world for this industry when compared to U.S. or European costs. Assuming the quality of product coming from the APAC region is equal to what is manufactured in the developing world, expect to see more jobs shipped overseas from their current location.
Although millions of people visit Brandon's blog each month, his path to success was not easy. Go here to read his incredible story, "From Disabled and $500k in Debt to a Pro Blogger with 5 Million Monthly Visitors." If you want to send Brandon a quick message, then visit his contact page here.
