Although rubber products have been used by local populations for thousands of years, it is only recently that rubber products suitable for tires and other products have been available. Vulcanized rubber was invented in 1839 by Charles Goodyear, and it is still considered the modern form of rubber.
Before Goodyear perfected the process of vulcanization, rubber products would change their characteristics based on local weather conditions. If it was hot, then the rubber would become sticky. If it was cold, then the rubber would become brittle.
Although rubber is a natural product, the tire and rubber industry rely on synthetic rubber products as well. The technology to develop synthetic rubber was developed in the United States during World War II as their access to natural rubber supplies was limited due to the conflict. Made from crude oil, there are currently about 20 grades of synthetics available and are used in a variety of products.
Important Tire and Rubber Industry Statistics
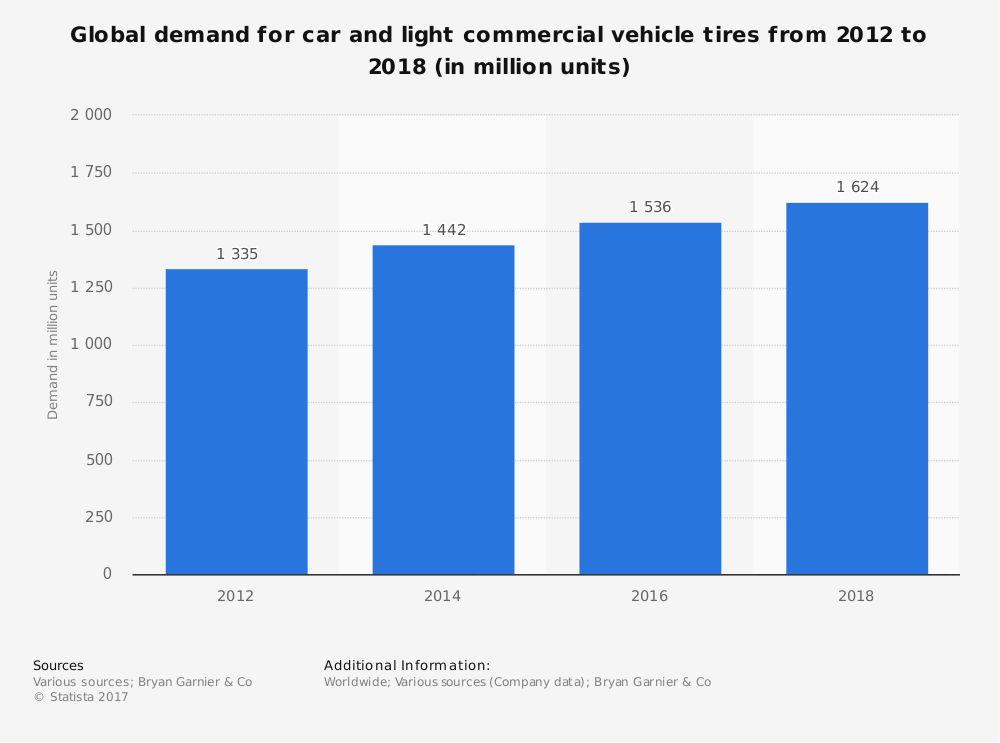
#1. In 2018, more than 1.6 billion units are expected to be sold by the tire and rubber industry for cars and light commercial vehicles. In 2012, the number of units sold were 1.33 billion. (Statista)
#2. In the United States, there are currently 111 businesses that are operating within the tire and rubber industry. When combined, they are responsible for more than 42,000 direct employment opportunities. (IBIS World)
#3. The tire and rubber industry generate about $18 billion in revenues each year, including aircraft and motor vehicle tires, inner tubing, and repair materials. Over the last 5-year period ending in 2017, the industry experienced an annual contraction of 3.3%. (IBIS World)
#4. In Europe, the tire and rubber industry are responsible for the direct employment of over 361,000 workers as of 2016. This figure represented a 1% increase in employment opportunities from the year before. (European Tyre and Rubber Manufacturers’ Association)
#5. The number of companies operating within the European segment of the tire and rubber industry has contracted by 2% since 2015, totaling just over 4,300 organizations today. (European Tyre and Rubber Manufacturers’ Association)
#6. About 4.94 million tons of tires are sold in Europe, representing a 1% increase from 2015 figures. About 14 million units are sold for light commercial vehicles and 289 million units are sold for cars. (European Tyre and Rubber Manufacturers’ Association)
#7. Approximately 60% of the world’s rubber supply is consumed by the global tire industry. The remainder is used for mulch, rubber bands, boots, and other consumer products. (Statista)
#8. About 27.5 million metric tons of rubber is consumed around the world each year. In 2016, consumption levels exceeded production levels, which were at 27.2 million metric tons. (Statista)
#9. Global production of natural rubber products accounts for less than half of the world’s total rubber production levels. In 2016, about 12.4 million metric tons of natural rubber products were produced by the industry. (Statista)
#10. The Asia-Pacific region is the world’s largest consumer of natural rubber products. In 2016, more than 5.5 million metric tons, just under 50% of the total global supply, were consumed within this region. (Statista)
#11. The Asia-Pacific region is also the world’s largest producing region for synthetic rubber products. Almost 4 million metric tons of synthetic rubber products are produced within the region annually. (Statista)
#12. The total amount of revenues generated annually by car tires is $32.1 billion. Passenger vehicle tires are the largest segment of the industry, accounting for $21.8 billion in revenues. (Statistic Brain)
#13. Farming tires, a segment valued at $502 million, have a higher value for the tire and rubber industry than off-road tires, which are valued at $401 million. (Statistic Brain)
#14. Heavy truck tires are a major revenue contributor to the tire and rubber industry, accounting for $5.1 billion in annual revenues. Light truck tires contribute another $4.3 billion annually. (Statistic Brain)
#15. Goodyear has the largest market share of the tire industry, accounting for 15.5% of all sales each year. Michelin comes in second, with a 12% market share. Bridgestone and Yokohama follow, each with an 8% market share. (Statistic Brain)
#16. 61% of tire sales occur through independent tire dealers. Auto dealerships account for just 6.5% of all tire sales each year. Tire company-owned stores don’t fare much better, with a 7.5% market share. (Statistic Brain)
#17. Despite leading in market share, dealers have ranked Michelin as the top tire brand every year since 2006. In 2016, Goodyear was ranked third, behind Michelin and Bridgestone. (Modern Tire Dealer)
#18. Original equipment shipments within the industry were down slightly in 2016 from the year before, by 100,000 total units. Total shipments to tire dealers, however, increased by almost 7%. (Modern Tire Dealer)
#19. U.S. consumer tire imports from China were down by over 35% in 2016, with 19 million units sold. (Modern Tire Dealer)
#20. In the United States, Goodyear owns 600 tire stores. Bridgestone owns 2,200 stores. In comparison, Nokian owns just 76 stores, or a 3% market share. (Modern Tire Dealer)
#21. The average sales margin for wholesale and independent truck tire dealers was 9.5% and 15% respectively. The overall marking on light truck tires in 2016 was over 19%. (Modern Tire Dealer)
#22. Firestone owns a 22% market share of the farm tire market in the United States for small farm replacement tires. (Modern Tire Dealer)
#23. Tires with 17-inch sizes and above represent more than 56% of the available tires found in the industry today. They sell at an average price of $115.36. (Modern Tire Dealer)
Tire and Rubber Industry Trends and Forecast
As long as we have vehicles within our global transportation networks, there will be a demand for tires within the rubber industry. Because of its unique qualities, there will also be a natural demand for other rubber products, from clothing to office supplies, that will keep revenues rising for the industry.
With the exception of 2009, which was the peak year of the Great Recession globally, natural rubber production levels have continued to increase. Since 2011, synthetic rubber production has remained stable as well, hovering around 14.3 million metric tons globally each year. Despite these high levels, demand continues to outweigh productivity for the industry.
Because of production shortages, the price for rubber products will continue to see value increases over the next 5-year and 10-year periods. Increased production by the industry will help to satisfy demand to some extent, as well as total areas of production for natural rubber.
In 2017, the average price of rubber per ton was just over $1,700. Although the price for rubber has almost been halved since 2011, the revenues and profitability of the industry are unquestionable.
Although millions of people visit Brandon's blog each month, his path to success was not easy. Go here to read his incredible story, "From Disabled and $500k in Debt to a Pro Blogger with 5 Million Monthly Visitors." If you want to send Brandon a quick message, then visit his contact page here. Brandon is currently the CEO of Aided.