The sheep industry has a long history globally, with it being one of the few multi-purpose animals that have been raised for meat and wool production over the course of the last 2,000 years. It is an industry which has anchored deep roots in the United States in recent years, with some producers even raising the animals for milking.
In the annual inventory taken on January 1, 2018, the sheep and lamb population in the United States totaled 5.23 million head. Breeding sheep inventory was down 1%, to 3.83 million head. Ewes that were 1-year-old or older were counted at 3.01 million head, which also reflects a 1% decline.
Market sheep in the United States, however, were up 2%, with a total of 1.4 million head. 94% of the population of market sheep are labs.
From a global industry perspective, there are 1 billion head in the world today. 19% of the global sheep population is found in Africa and Asia. North and South America, with both continents combined, still produced half as much sheep products than Australia and New Zealand together.
Important Sheep Industry Statistics
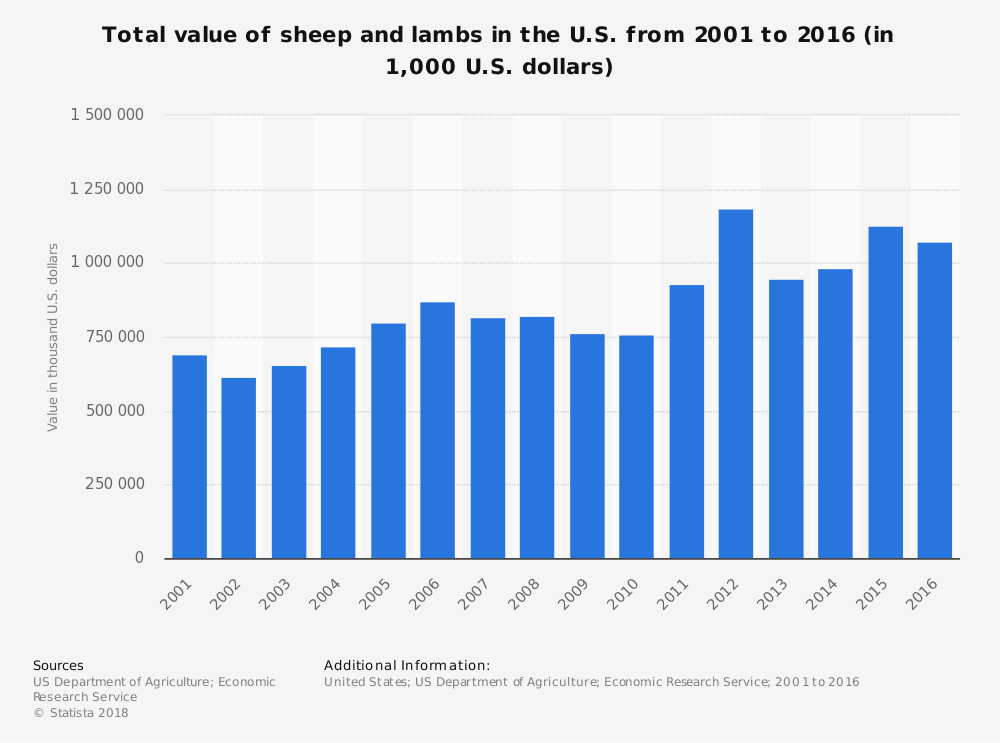
#1. Total revenues generated by sheep farming in the United States are $799 million per year. Since 2013, the industry has seen an annual decline in revenues of 0.2%. (IBIS World)
#2. About 100,000 firms are currently operating within the sheep farming sector of the industry, providing about the same number of direct employment opportunities in the United States. (IBIS World)

#3. Since the 1960s, the per capita consumption of lamb and mutton products in the United States had dropped from 5 pounds to just 1 pound. (U.S. Department of Agriculture)
#4. About 70% of the sheep industry in the United States is located in the Southern Plains, Pacific, and Mountain regions of the country. Texas is the home to the largest sheep population in the U.S., followed by California. (U.S. Department of Agriculture)
#5. Imports account for almost 50% of total U.S. meat consumption that comes from the sheep industry. About 70% of lamb imports originate from Australia, with the rest coming from New Zealand. (U.S. Department of Agriculture)
#6. Although the total census numbers for sheep and lamb have remained consistent since the 1960s, when 11 billion pounds were produced, productivity increases have caused global production levels to reach 18 billion pounds annually. (Agricultural Marketing Resource Center)
#7. Sheep inventory levels in Australia have declined to 22 million head as of the 2016 census. In New Zealand, the 2016 census counted 23.7 million head. (Agricultural Marketing Resource Center)
#8. The last published census for Europe was in 2013, when the sheep industry supported 98 million head. (Agricultural Marketing Resource Center)
#9. In 2014, the global average consumption of lamb products was 4 pounds per person. In Australia, the average person consumes 19 pounds of sheep and lamb products, while people in Kazakhstan consume 18 pounds per person. (Agricultural Marketing Resource Center)
#10. Australia exports 44% of its lamb production each year and 80% of its mutton crop. (Agricultural Marketing Resource Center)

#11. New Zealand exports 80% of its lamb production and 84% of its mutton crop each year. (Agricultural Marketing Resource Center)
#12. The EU-28 accounts for 57% of the current lamb export value that New Zealand generates each year. The United Kingdom represents 19% of the market, followed by China (12%), and the United States (7%). (Agricultural Marketing Resource Center)
#13. Only 2% of the domestic supplies generated by the sheep industry in the United States each year is exported. (Agricultural Marketing Resource Center)
#14. 490 million pounds of lamb and mutton are imported to the European Union each year. In comparison, about 140 million pounds of lamb are imported by the United States. (Agricultural Marketing Resource Center)
#15. The wool industry producers about 1.16 billion kilograms of clean wool each year. The average sheep will provide about 4.5 kilograms of wool over the course of a year, which results in about 10 meters of fabric being produced. (International Wool Textile Organization)
#16. Although China is responsible for 14% of the total sheep population, Australia matches their 20.1% market share of world wool production. New Zealand provides 7.3% of the available wool. (International Wool Textile Organization)
#17. There are currently more than 500 different breeds of sheep which grow wool in a variety of lengths, textures, and colors. (International Wool Textile Organization)
#18. Since 2008, more wool has been used to create interior textiles, such as carpet, than has been used to create personal apparel. (International Wool Textile Organization)
#19. Although wool makes up just 1.3% of the global textile fibers that are used, it holds a 5% share of the recycled fibers that are used to make products. (International Wool Textile Organization)
#20. Pure organic carbon makes up 50% of the weight wool contains, which is higher than cotton (40%) or cellulosic materials like viscose (24%). (International Wool Textile Organization)
#21. Around 4% of the global lamb population dies each year because of poor nutrition when producers are focused on wool production. (PETA)
#22. $2 billion in direct economic contributions are made by the U.S. sheep industry each year. About 88,000 producers are currently operating in the country. (American Sheep Industry Association)
#23. The global value of the sheep industry in 2014 was $6.7 billion, with about 8.7 million tons of products made available to the import/export market. (AHDB)
Sheep Industry Trends and Analysis
China’s approach to the sheep industry is going to determine what happens in the next 5-year and 10-year forecast periods. Small changes to wool consumption or eating habits within the population create large changes for the industry. Increased import demands from China will create stronger revenues, which may encourage smaller producers, such as the United States, to re-examine their stance within the industry.
If China puts less pressure on the import market, prices are likely to fall and smaller producers may look for agricultural products which produce better cash results in the short-term for them.
Domestic increases in sheep production in China will also affect the industry. 24% of global meat production originates in China and that is based on incomplete reporting numbers.
Increases to the wool and milk segments will help to offset some potential losses that producers might experience. Overall, however, the slight declines experienced by the industry in recent years is a trend which looks to continue.
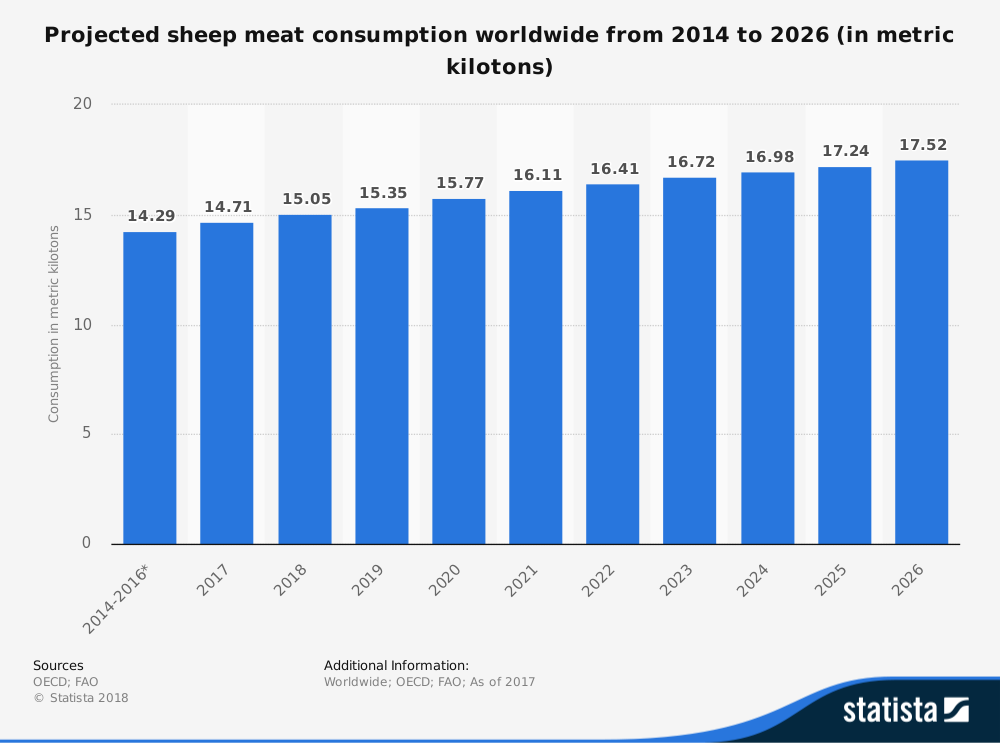
Global increases in consumption of about 1.3% are expected per year as global population levels increase. Much of this will occur outside of the developed economies, which are expected to see a 0.7% annual increased. Although the data suggests there may be struggles ahead, the industry is not expected to lose any market share to beef.
Although millions of people visit Brandon's blog each month, his path to success was not easy. Go here to read his incredible story, "From Disabled and $500k in Debt to a Pro Blogger with 5 Million Monthly Visitors." If you want to send Brandon a quick message, then visit his contact page here.
