Some of today’s most popular fashion labels have found the Indonesia footwear industry to be a place of consistently strong growth. Brands such as Zara, Forever 21, and Pull and Bear have helped to boost footwear sales for more than a decade and strong growth trends are expected through at least 2022.
From a domestic standpoint, the youth of Indonesia love being able to access brands that are labeled as “Western.” When combined with the exports that are available to the industry, there are numerous opportunities to grow revenues. Bata continues to lead the industry in overall sales, with its reputation of quality and affordability well-established in Indonesia.
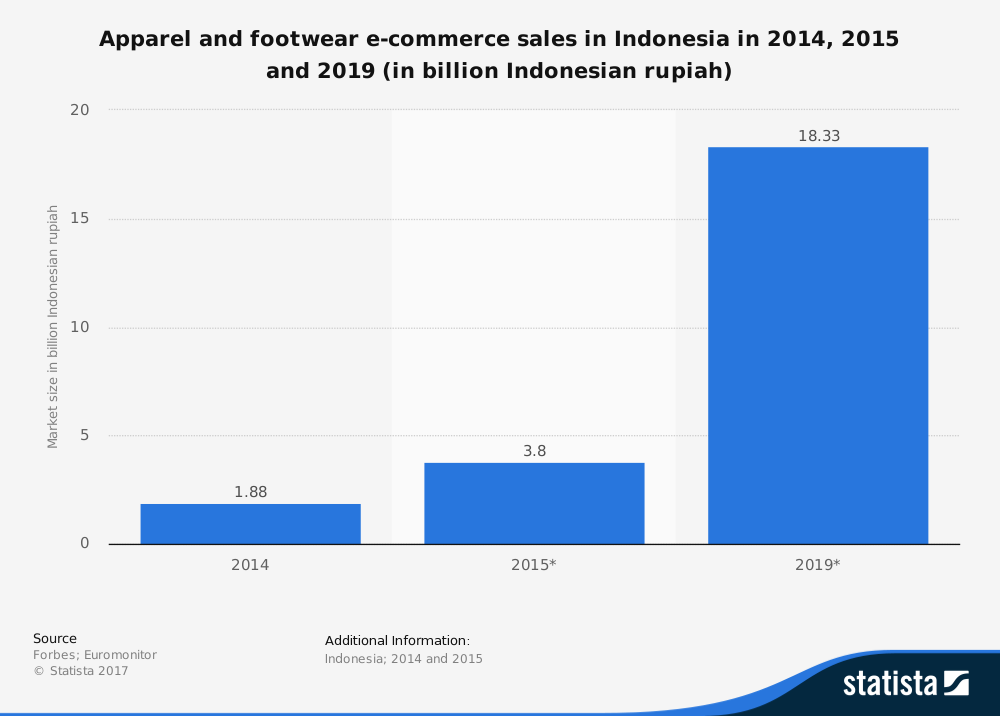
As more international competition comes into the market, the Indonesia footwear industry could experience some changes. Internet sales of footwear is also expected to be a major influence on the industry in the next 5-year forecast.
Important Indonesian Footwear Industry Statistics
#1. Revenue in the shoes segment of the Indonesian footwear industry is anticipated to have a value of $387 million by the end of 2018. (Statista)
#2. Revenues are forecast to achieve a CAGR of 16.7% annually through 2022 for the shoes segment, which would result in a total market volume of nearly $720 million. (Statista)
#3. In 2018, user penetration rates for the shoes segment of the industry are expected to be 5%. In 2022, rates are forecast to reach 8.5%. (Statista)
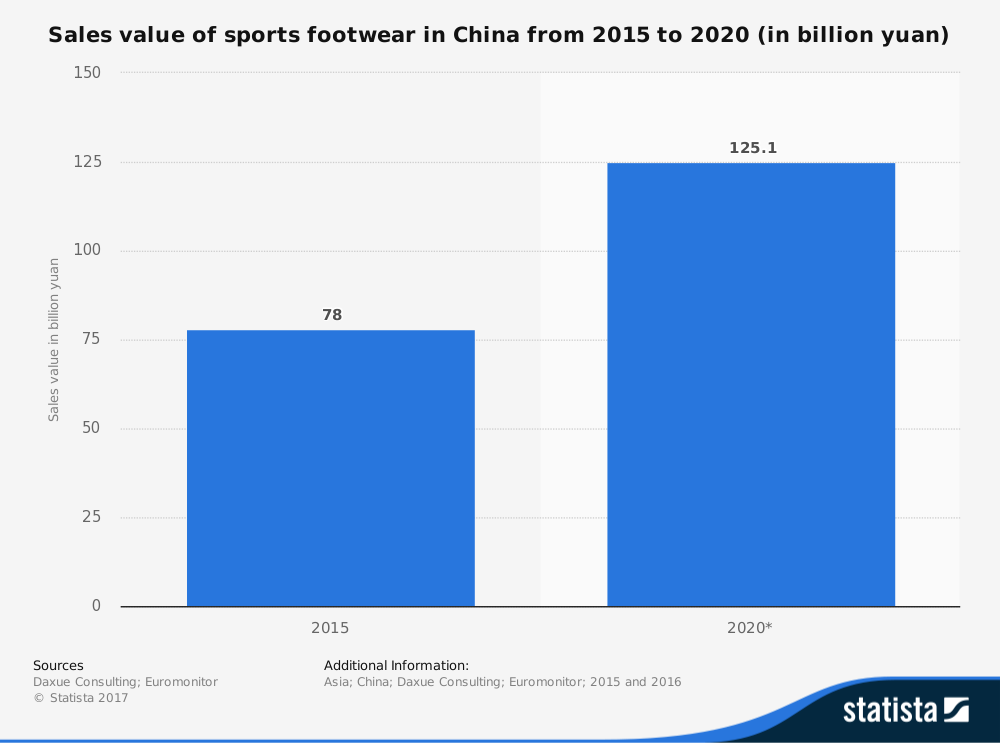
#4. The average revenue per user for the Indonesian footwear industry is currently $28.68. Most of the revenue that is generated by the industry is based in China, which was responsible for over $35 billion. (Statista)
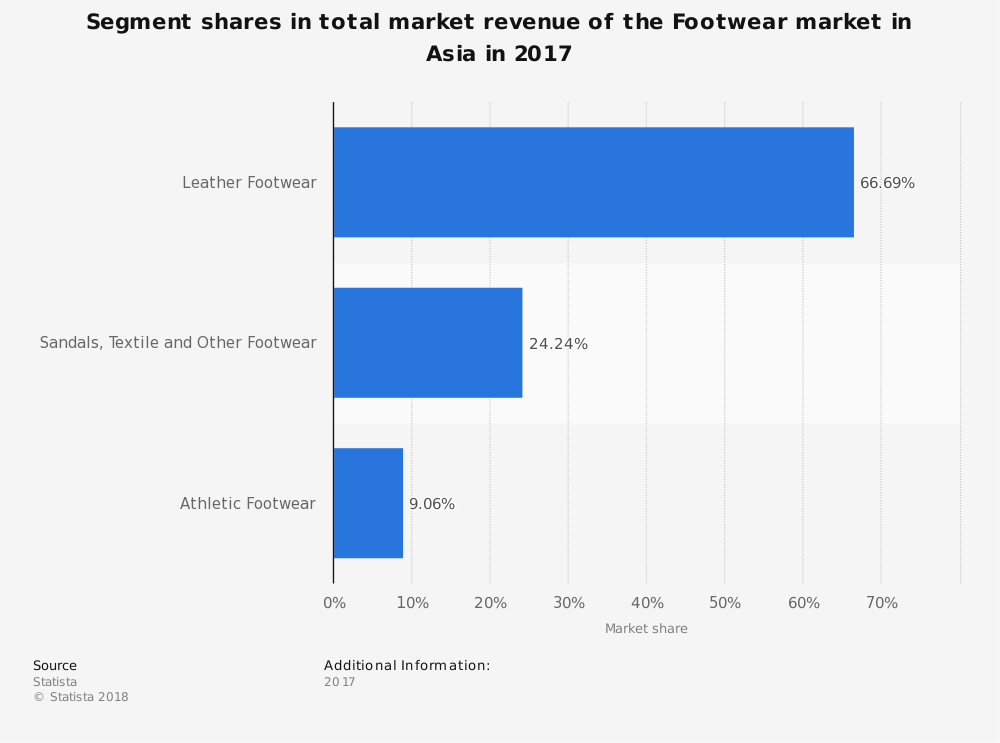
#5. The largest segment for the Indonesian footwear industry comes from leather footwear. In 2018, the anticipated market volume for this segment is expected to reach $2.36 billion. (Statista)
#6. The United States is the largest market for the leather footwear segment. Total revenues generated in the U.S. for the industry are expected to reach $83.7 billion by the end of 2018. (Statista)
#7. In relation to total population figures, revenues per person from U.S. sales are expected to be $14.13 at the end of 2018. (Statista)
#8. In 2016, the Indonesia footwear industry experienced a growth rate of 2.9% for exports, but saw a 16.9% increase in imports for new footwear. This is due to lower labor costs and new factories coming online in Vietnam, China, and South Korea. (Jakarta Post)
#9. The largest portion of footwear exports goes to the United States each year. Over 28% of footwear exports hits the U.S. market annually. Other top export markets include Japan, Germany, Belgium, and China. (Jakarta Post)
#10. About 45% of footwear imports that occur for the industry come from China, which is followed by Vietnam, Hong Kong, and the United States. (Jakarta Post)
#11. 7 different shoemakers and leather processors announced in 2016 that they would commit to investments totally $262.18 million through the end of 2018. (Jakarta Post)
#12. About 15 new footwear factories became active in Indonesia in 2016. Their combined value of $1.5 billion increased the overall capacity of the industry by more than 15 million pairs of shoes. These new factories are also providing direct employment opportunities to over 100,000 people. (Indonesia Investments)
#13. Total footwear exports had a total value of $4.5 billion in 2015. (Indonesia Investments)
#14. Household spending on footwear domestically increased by 47% over a 5-year period that ended in 2012. (Euromonitor).
#15. In 2013, small businesses and micro brands within the Indonesian footwear industry saw their output grow by over 9%. Medium-sized and large businesses within the industries saw their output grow by 4.2% in the same period. This is after the industry saw outputs contract by 7% for their largest producers in 2012. (Global Business Guide Indonesia)
#16. The industry is the sixth-leading exporter of footwear products in the world today. China leads the way, with more than $50 billion in exports annually. Italy and Vietnam both export more than $11 billion in footwear products. Germany and Belgium export more than $5.1 billion in footwear as well. (Global Business Guide Indonesia)
#17. Annual minimum wages were increased by more than 40% in some segments of the Indonesian footwear industry in 2013 due to strikes and protests. This caused the industry’s labor advantage over China to decline and even forced some factories to close their doors. (Global Business Guide Indonesia)
#18. Cost pressures within the Indonesian footwear industry continue to rise. Many factories use equipment that is at least 10 years old, while the percentage of equipment that is 20+ years old continues to rise with each year. (Global Business Guide Indonesia)
#19. In 2012, Nike employed 175,000 local workers within the Indonesian footwear industry and created relationships of cooperation with 38 different manufacturing companies. The brand’s total exports for that year reached $1.5 billion for the first time. (Flanders Investment and Trade)
#20. The Indonesian footwear industry employs about 400,000 people each year, while providing another 210,000 indirect employment opportunities. About 5% of the total manufacturing employment of Indonesia comes from the footwear industry. (Flanders Investment and Trade)
#21. Waterproof footwear is the most common type that is traded by the industry for imports, accounting for 48% of the total market. This was followed by a generic “other” category (35%) and textile footwear (10%). (Flanders Investment and Trade)
#22. Leather footwear makes up the lion’s share of the export market, accounting for 68% of total shipments. This is followed by waterproof footwear (18%) and textile footwear (17%). (Flanders Investment and Trade)
#23. 55% of the firms that are active in the Indonesian footwear industry are located in West Java and Banten. East Java accounts for 25% of the firms, while DKI Jakarta accounts for 14% of the industry’s presence. (Flanders Investment and Trade)
Indonesian Footwear Industry Trends and Analysis
The children’s footwear segment looks to be the strongest in the coming decade for the Indonesian footwear industry. Couples are trending younger in marriage and in having children, which could provide an indirect rise in sales. International brands will likely dominate this sector, but look for local brands to remain competitive by boosting the overall quality of their shoes.
The outlook for women’s footwear looks to remain positive as well. The average woman owns 5 pairs of shoes in Indonesia, so watch for domestic brands to create designs that appeal to fashion and affordability to remain dominant.
Exports will continue to remain strong, despite competition from cheaper labor markets and rising imports. The Indonesian footwear industry has established a reputation for itself of being a good value option. That is not going to change any time soon.
Although millions of people visit Brandon's blog each month, his path to success was not easy. Go here to read his incredible story, "From Disabled and $500k in Debt to a Pro Blogger with 5 Million Monthly Visitors." If you want to send Brandon a quick message, then visit his contact page here. Brandon is currently the CEO of Aided.