Paperboard is a thick material that is similar to a regular sheet of paper. It is usually thicker than paper, however, at 12 points and has more flexibility in its applications. Paperboard typically has better rigidity than other paper products and it can be folded better as well.
It was first produced in the early 19th century in England. By the 1860s, folding cartons were being produced to save on shipping space and costs. In 1915, the first milk carton produced with paperboard was created. The paperboard industry serves the publishing industry, as the product is excellent for graphic printing needs, such as books or for magazine covers. If you hold a postcard, you’re also holding a paperboard product.
Important Paperboard Industry Statistics
#1. The global production of paper, paperboard, and cardboard products in 2014 was about 407 million metric tons. About 33% of this production was for graphic paper, with 50% of the production dedicated to packaging paper. (Statista)
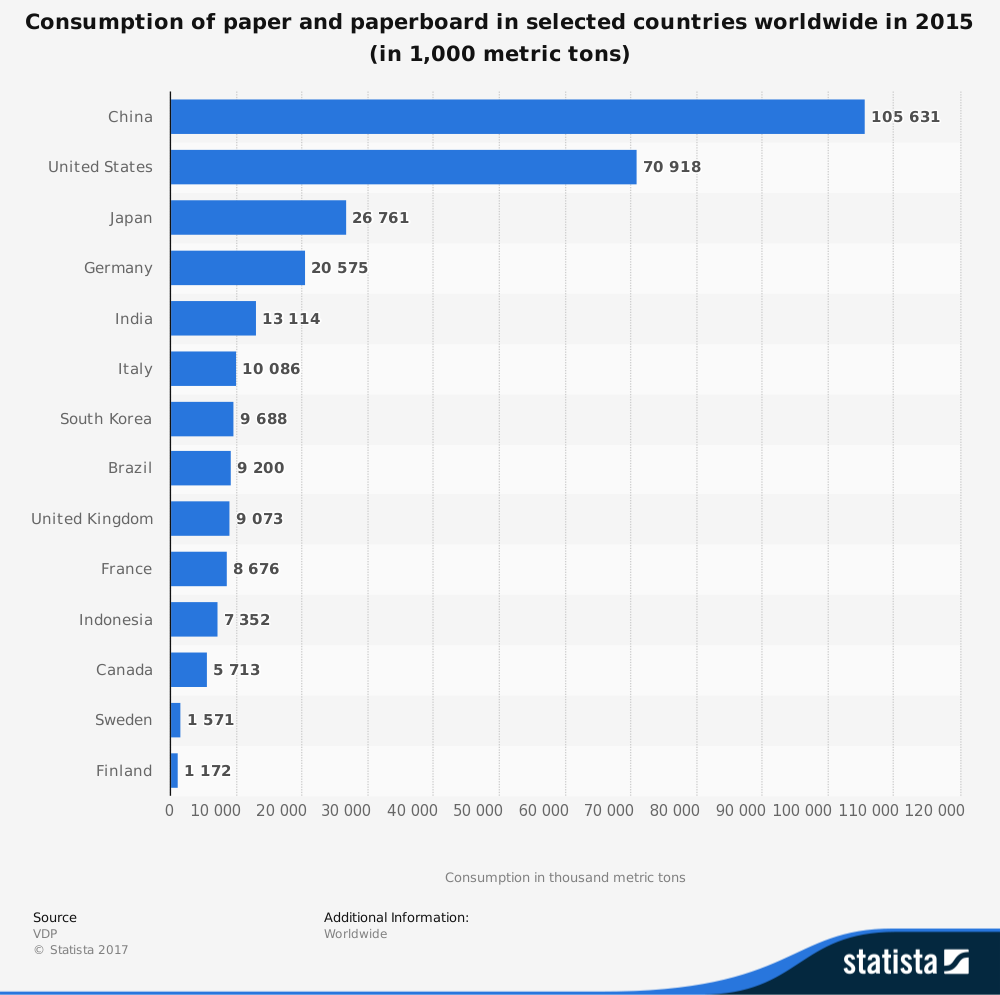
#2. The production volume of paperboard products is dominated by the United States, China, and Japan. Together, these three countries are responsible for more than half of the world’s paper production totals. (Statista)
#3. Germany is the world’s leading importer of paper products. The United States is the world’s leading exporter of paper products. (Statista)
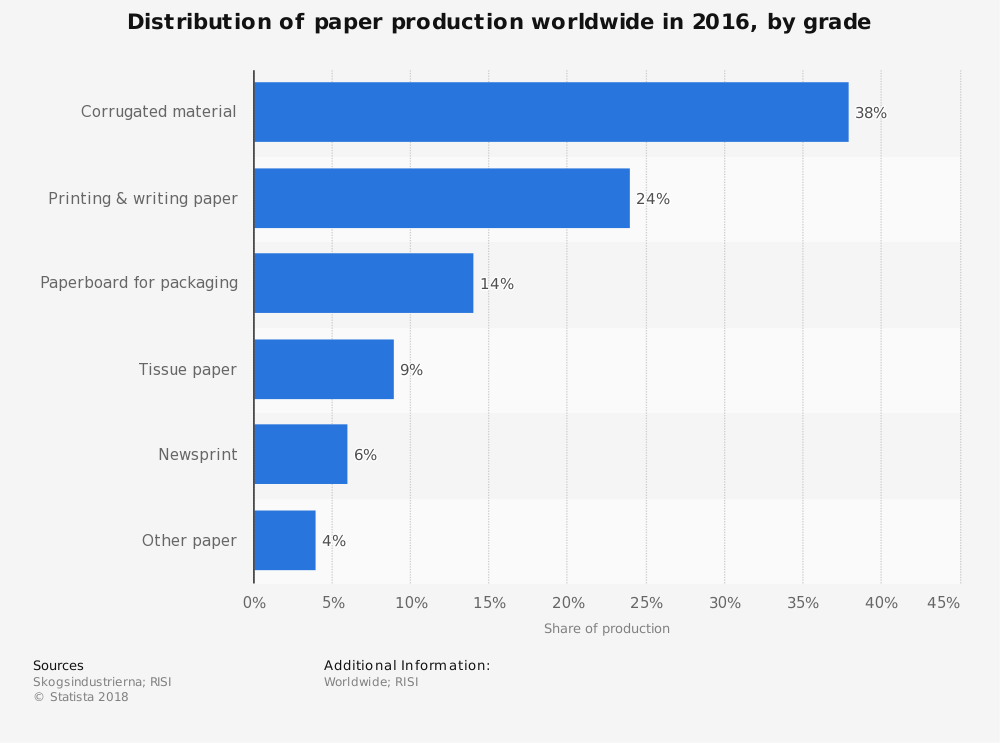
#4. 38% of global paper production is dedicated to the creation of corrugated materials. (Statista)
#5. In terms of value, the market share for the gross output from paper mills based in the United States averages more than $44 billion per year. Value added by U.S. paper products manufacturing reaches an average of $58 billion per year. (Statista)
#6. There are more than 19 billion tons of writing paper supplies currently available in the United States. (Statista)
#7. The average global consumption of paper and paperboard products per person is 57 kilograms. In the United States, the average person consumes 229 kilograms of paper and paperboard products each year. (Statista)
#8. International Paper is the largest company in the United States within the paperboard industry. They generate annual revenues which average more than $20 billion. In comparison, UPM-Kymmene earns about $1 billion per year, Asia Pulp and Paper earns about $3.7 billion per year, and Stora Enso earns about 10 billion EUR per year. (Statista)
#9. Paperboard mills in the United States generate about $31 billion per year in total. For the 5-year period ending in 2017, the industry achieved an annual growth rate of 0.4%. (IBIS World)
#10. There are about 150 businesses currently operating in the U.S. that produce paperboard products. Combined, these companies offer about 37,000 direct employment opportunities. (IBIS World)
#11. When packaging products are included with the paperboard industry, the estimated U.S. market size is $130 billion. It is forecast to grow with a CAGR of 7.5% through 2024. (Global Market Insights)
#12. In 2016, the U.S. paperboard industry shipped 4.9 million tons of packaging materials. That created an average value per ton of $1,753. (Paperboard Packaging Council)
#13. The total number of employees has been generally stable within the paperboard industry. In 2008, a peak year of 43,000 direct jobs were created by the industry. (Paperboard Packaging Council)
#14. Although industry employment has been relatively stable, total payrolls have been increasing consistently since 2009. In 2012, a total payroll of more than $2 billion was achieved for the first time. The estimated payroll in 2015 was a record $2.196 billion. (Paperboard Packaging Council)
#15. In the forecast period ending in 2020, the paperboard industry is expected to grow tonnage at an average annual rate of 0.5%. The average value per ton is expected to stay stable, with a small annual drop in value of 0.1%. (Paperboard Packaging Council)
#16. Private companies that are independently owned, as converters without their own mill, make up 20% of the sales experienced by the paperboard industry each year. Industry consolidation has dropped this market share by 10 percentage points in the past 15 years. (Paperboard Packaging Council)
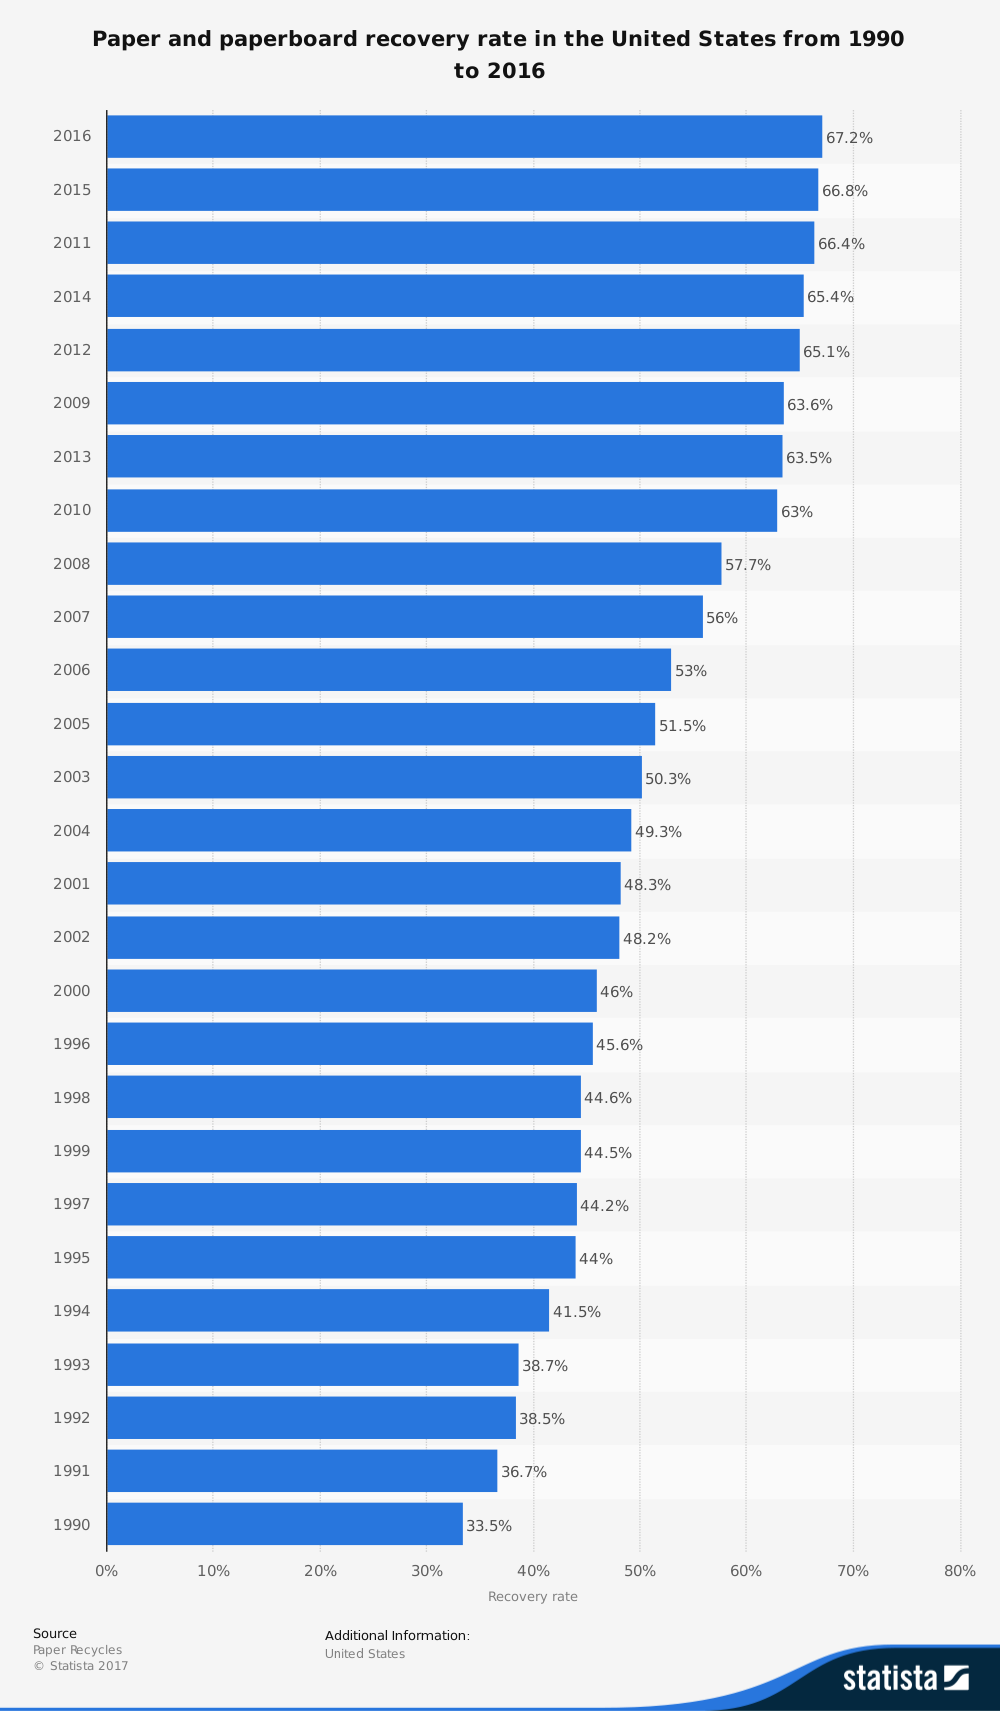
#17. Over 60% of communities in the U.S. are collecting used paperboard as part of their local recycling program. This exceeds the current recyclable thresholds that are published by the Federal Trade Commission. (Paperboard Packaging Council)
#18. When corrugated boxes are combined with paperboard boxes for the U.S. market, the forecast for the industry is to achieve total revenues of $41.2 billion by 2020. That would result in an annual 2.6% increase within the industry. (Freedonia Group)
#19. By the end of 2018, the folding carton segment of the paperboard industry is expected to achieve total revenues of $9.9 billion. This would be a 1.4% total increase for the segment. (RISI Technology Channels)
#20. In Canada, there are 175 organizations that are currently producing products for the paperboard industry. 49% of these establishments employ fewer than 100 people. (Statistics Canada)
#21. The average Canadian establishment in the paperboard industry generates $785,000 in revenues annually. About 3 out of 4 organizations are considered to be profitable. About $1.8 billion in salaries are paid by the Canadian industry each year. (Statistics Canada)
#22. Saskatchewan has seen the highest levels of GDP growth within the Canadian industry, achieving 38% growth in 2016. In comparison, the province of Alberta saw GDP growth from the industry of just 1.4%. (Statistics Canada)
Paperboard Industry Trends and Forecast
If you ever thought that the paperboard industry would disappear, then it is time to give the industry a second look. Although graphic papers are seeing reduced market shares as consumers convert to digital graphics opportunities, the industry is also transforming itself with new products and services.
More people are using online shopping opportunities to ship items directly to their home. That has allowed the paperboard industry to fill the gaps left by a shrinking graphics paper segment.
The highest CAGR prospects will occur in China, Eastern Europe, Latin America, and the Asia-Pacific region in general. In craft paper, cartonboard, and containerboard products, a 2.0% CAGR or higher is expected in each region. Other regions will still see a positive CAGR through at least 2021.
At the same time, graphic papers are expected to see an overall negative CAGR continue.
How these trends translate to profits will be influenced by the actions taken by the industry. Supply movements can be difficult to predict, so forecast models are difficult to create. If history is our teacher, however, then the paperboard industry looks poised to make a major comeback.
Although millions of people visit Brandon's blog each month, his path to success was not easy. Go here to read his incredible story, "From Disabled and $500k in Debt to a Pro Blogger with 5 Million Monthly Visitors." If you want to send Brandon a quick message, then visit his contact page here. Brandon is currently the CEO of Aided.