Infographics are the graphic visual representations of data, information, or knowledge. Their main aim is to present information to the user clearly and quickly. Sharing of SEO Infographics is 2.3 times higher than the usual blog posts. In the age where an item can go viral on the internet within seconds of publishing, you need to do more to ensure your Infographics are worthy of a share. Below are the golden secrets to employ when creating infographics to make it share-worthy.
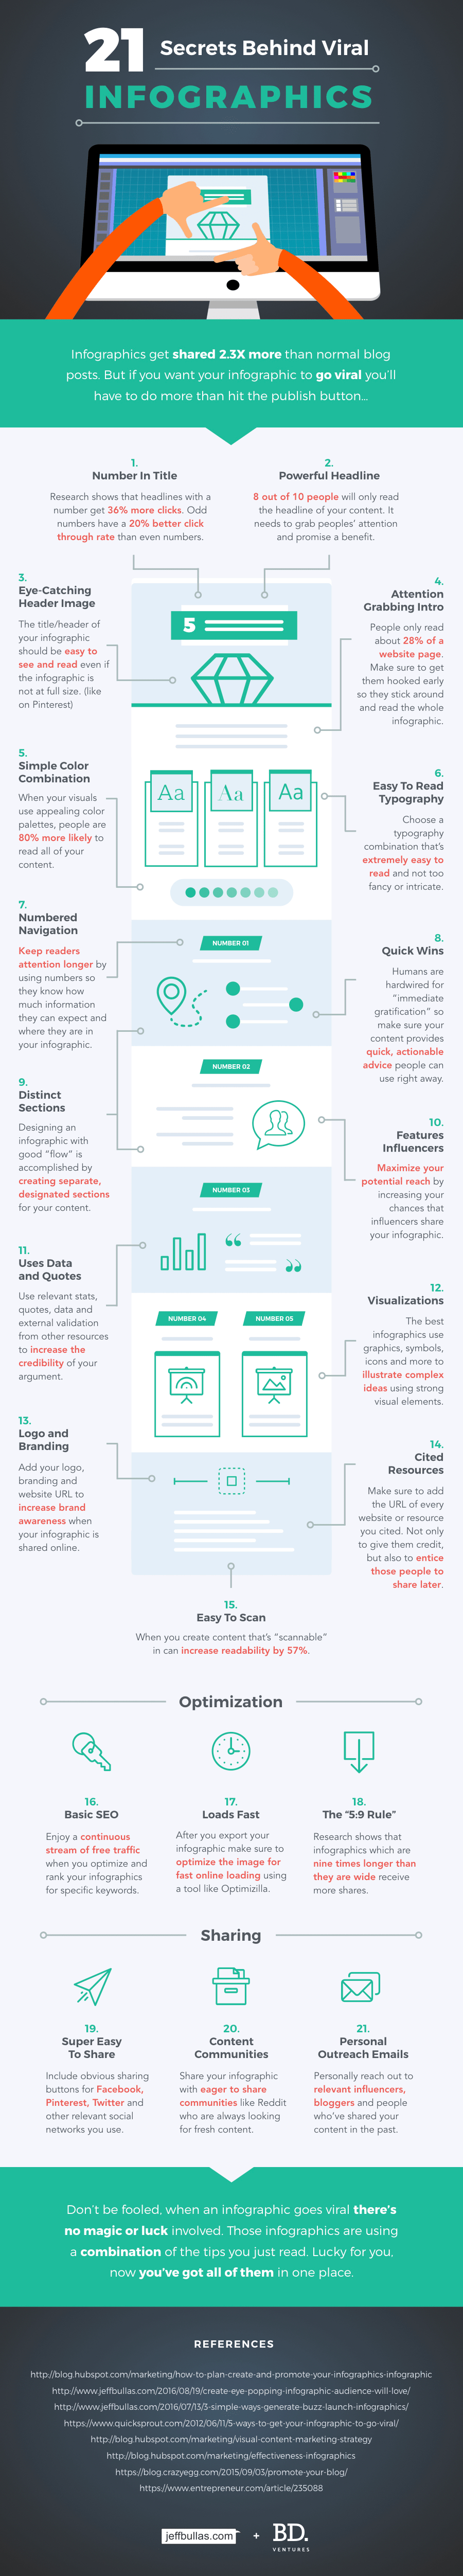
1) Compelling Headline with Numbers.
The infographics with most shares are those that have numbers in the title. According to research, titles with numbers got 36% more clicks with odd numbers getting 20% clicks better than even numbers. On the search engine results, most people admitted to reading the headline first before going to the site. It is necessary for your content to have a compelling headline to grab the attention of the people while promising a benefit.
2) Attention Grabbing Header Image and Intro.
The header of your infographic should be easy to see and read despite the infographic not being full size. A good example is a format used on Pinterest. While most sites and blogs have informative infographics, your introduction to the infographic should grab the reader’s attention. Research has shown that people read roughly 28% of your site, and so it is important to get them hooked from the beginning.
3) Color and Typography.
Certain colors will pull the attention of a reader. When your infographics incorporate an appealing color palette, visitors to your site are up to 80% more likely to read the entire content. Choose a combination of typography that is easy for the site visitor to read. Avoid intricate and fancy typography that might seem too complicated for the reader.
4) Quick Solutions with Numbered Navigation.
It is human nature to desire an immediate gratification to the problems affecting them. In this light, ensure the content in your infographics provide actionable advice the reader can apply right away. Use numbers to keep your readers’ attention longer. This way they will know how much information they expect from the content in your infographics.
5) Use Sections and Influencers.
Infographics whose content has distinct sections present a good flow and is more likely to grab the attention of the reader. You can maximize the reach of your infographic by increasing the chances that features influencers share your infographics.
Finally, the most important thing is to use data and quotes on your infographics to validate your content. It also increases your credibility of the argument in your infographics.
Although millions of people visit Brandon's blog each month, his path to success was not easy. Go here to read his incredible story, "From Disabled and $500k in Debt to a Pro Blogger with 5 Million Monthly Visitors." If you want to send Brandon a quick message, then visit his contact page here. Brandon is currently the CEO of Aided.