In recent years, the remote sensing industry has merged with the commercial satellite imagery industry, allowing all of us to have access to basic data about our planet. In the past, high-flying aircraft would provide these services. Today, much of the industry can be automated or operated remotely.
In 1999, about 1% of Earth’s landmass was being photographed at a level of 0.5 meters. It created so much data that humans couldn’t analyze the information being relayed to them. Back then, this data was stored on 500 GB drives. Now the information exceeds what can be stored on 2 TB drives on a daily basis.
The development of the remote sensing industry has been unprecedented from an observational standpoint. Only now are we beginning to learn the true value of what this industry can provide in multiple ways.
Interesting Remote Sensing Industry Statistics
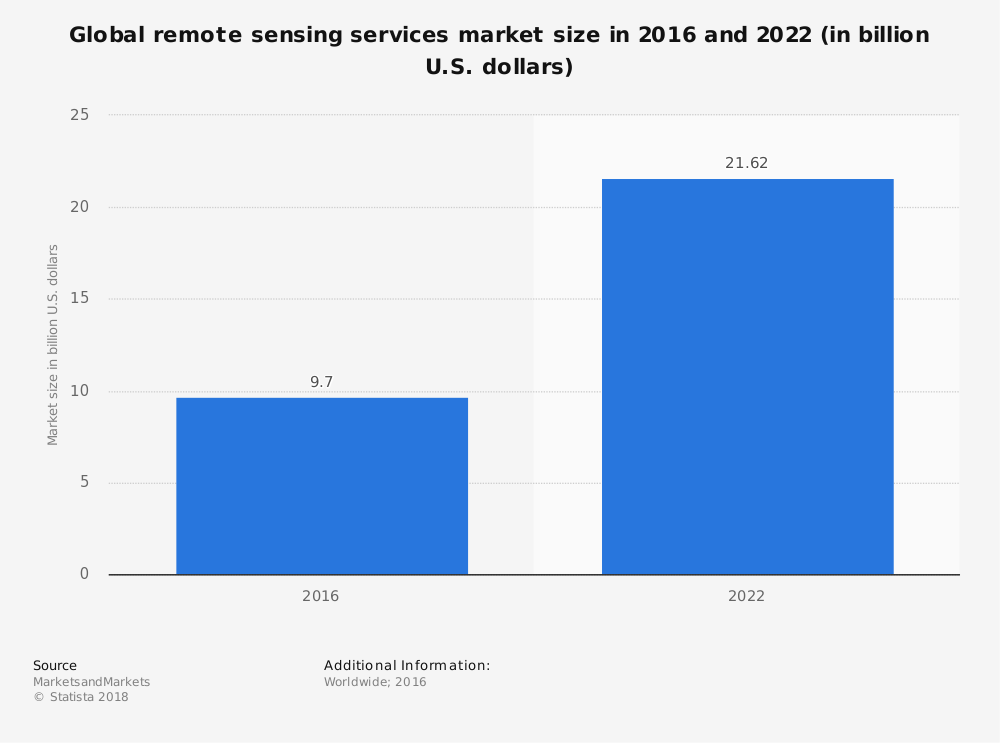
#1. In 2016, the global remote sensing industry was valued at $9.7 billion. Forecasts support a 15.1% CAGR for this industry through 2022, which could have it reach a total value of $21.62 billion. (Statista)
#2. In 2015, the space-based remote sensing industry segment had a value of $3.3 billion. Another $1 billion in revenues is expected to be generated by this industry by 2022. (Directions Magazine)
#3. High-resolution SAR data represented about 3% of the total data market in 2012. In comparison, the medium-resolution data segment was 6% of the total data market in the same year. (IEEE Geoscience and Remote Sensing Magazine)
#4. From 2001 to 2011, the number of countries with space programs grew from 26 to 49. (IEEE Geoscience and Remote Sensing Magazine)
#5. In 2017, the cost to build, and then launch, a satellite into orbit is $200,000. In 2007, the cost to accomplish the same task was $200 million, using capabilities that are virtually the same. (Tech Emergence)
#6. In 2015, venture capitalists almost double the amount of cash that was invested in the industry compared to the past 15 years combined. SpaceX led the way with $1 billion in investments, followed by OneWeb with $500 million. (IEEE Geoscience and Remote Sensing Magazine)
#7. From 2006-2015, there were 163 remote sensing satellites that were launched. By 2025, the number of new launches is expected to total 419 satellites. (Tech Emergence)
#8. 37% of global space economy revenues are based on internet needs. 19% is used for ground equipment applications, while 17% is utilized by the government. (Geospatial World)
#9. 205 of the private space economy is dominated by satellite launches. 18% is generated by the manufacturing sector. The other top contributors are Earth observation (14%), satellite internet (13%), and asteroid mining (5%). (Geospatial World)
#10. 21% of the remote sensing satellites in orbit are directed toward environmental monitoring. (Geospatial World)
#11. 40% of the satellite imagery that is produced by the remote sensing industry is purchased in North America. Asia purchases 20% of the data that is available, followed by Europe (18%) and the Middle East (10%). (Geospatial World)
#12. 61% of the data that is produced by remote sensing satellites is used by the Defense industry. Infrastructure industries purchase 10% of the data that is produced, while natural resources purchase 9% of the data. (Geospatial World)
#13. The European Space Agency has archived more than 1.5 perabytes of Earth Observation data since it began collecting it. They expect to exceed more than 2 perabytes of data in the coming years. (Institute for Defense Analyses)
#14. The average amount of archive growth achieved by NASA’s Earth observation activities is 1.7 TB per day as of 2011. (Institute for Defense Analyses)
#15. Since 2007, remote sensing revenues have been rising steadily, reaching more than $1.4 billion for the first time in 2013. In 2007, industry revenues were just $400 million. (Institute for Defense Analyses)
#16. Since 2008, the United States has been offering its Landsat data collecting from remote sensing activities for free. That has made it difficult for commercial entities to compete with similar products. (Institute for Defense Analyses)
#17. In 2014, the price per image produced by the remote sensing industry was nearly $40. In 2012, beginning in 2012, the price began to hover right above $10 per image. (Institute for Defense Analyses)
#18. In 2014, there were 23 total worldwide commercial orbital launches. The United States was responsible for 48% of the launches, followed by Europe with 26% of total launches. Russia had 4 commercial launches, while India performed just 1. (Institute for Defense Analyses)
#19. 412 total payloads were launched by the United States, with 34% of them involving military customers. 47% involved institutional customers. (Institute for Defense Analyses)
#20. 31% of the launches performed by Russia are funded by private customers. 42% of their payloads are domestic, compared to 92% of U.S. payloads. (Institute for Defense Analyses)
#21. In 2014, there were 90 medium or large satellites that were launched into orbit. 20 of those satellites were competitively awarded through the international market. 9 of those 20 satellites were won by SpaceX. (Institute for Defense Analyses)
Remote Sensing Industry Trends and Analysis
The remote sensing industry has seen incredible growth over the past 20 years. Cost, which was the primary barrier to entry for the industry for so long, has been reduced by over 90% since the 1980s. That has made it reasonable for the private sector to get involved with this industry, which used to be a government-funded option only.
That is why venture capitalists have been flooding the remote sensing industry with lots of cash since 2015. The return that these investments will bring, however, is still up for debate.
Although the defense sector has moved away from being the primary provider of remote sensing services, they are still the primary customer of this industry. New applications for remote sensing products have been slow to develop. The need for high-resolution images is a niche that the average household has a limited need for personal use.
Although millions of people visit Brandon's blog each month, his path to success was not easy. Go here to read his incredible story, "From Disabled and $500k in Debt to a Pro Blogger with 5 Million Monthly Visitors." If you want to send Brandon a quick message, then visit his contact page here. Brandon is currently the CEO of Aided.