In 2017, the global dairy cow volume that was produced totaled 216 metric tons. Liquid milk is the largest share of the global market for dairy products, responsible for 54% of what is available Yogurt is the second-most popular product.
The United States does not lead the world in total dairy cow population or total production. India is the home to the most dairy cows in the world, with an estimated 56.5 million in 2017. Europe leads the world in total milk production levels. Since 2000, however, China has tripled its dairy output to become a global leader as well.
The compound annual growth rate of the dairy market in Asia is currently 3.7%. This growth is supported by over $45 billion in annual dairy exports around the world.
Interesting Dairy Cow Industry Statistics
#1. The average dairy cow will consume up to 100 pounds of food every day. They also consume about 35 gallons of water, which is comparable to what you’d have in the average bathtub. (The Wisconsin Cheeseman)
#2. In the United States, the average dairy cow will produce over 6 gallons of milk every day. For the lifetime of the average dairy cow, that adds up to 350,000 glasses of milk on 2,300 gallons produced annually. (The Wisconsin Cheeseman)
#3. Dairy farms in the United States produce 21 billion gallons of milk each year. (The Wisconsin Cheeseman)
#4. Milk that is taken from dairy farmers in the U.S. is turned into over 300 different varieties of cheese. The most popular cheese variety sold in the United States is cheddar. (The Wisconsin Cheeseman)
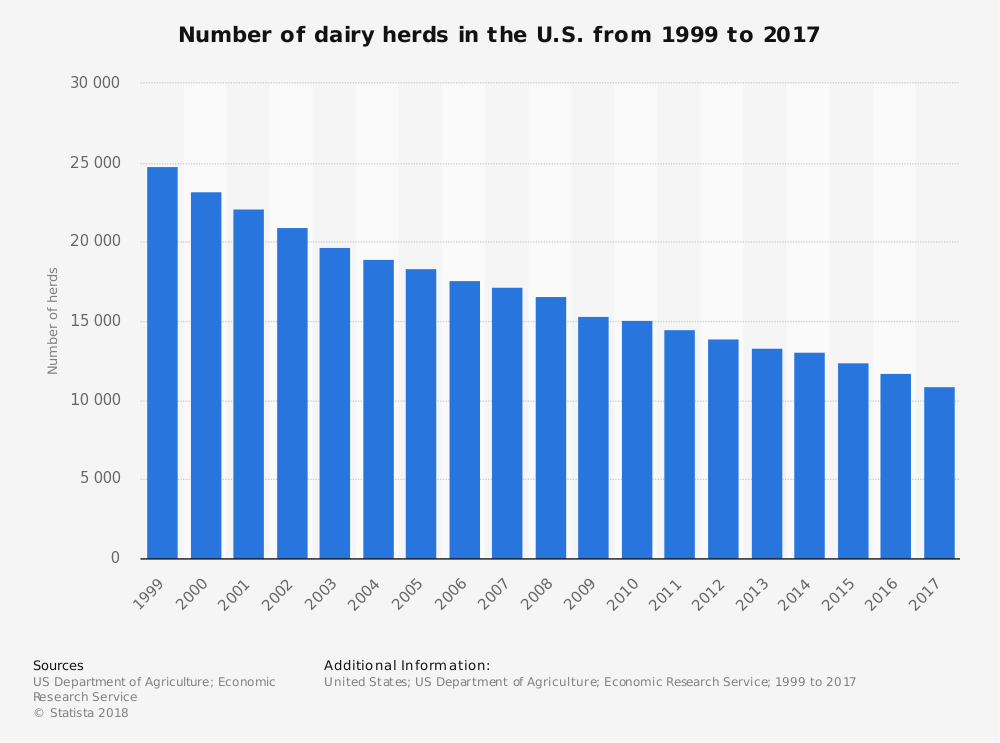
#5. Over 43,000 dairy farms are currently active in the United States, providing milk and dairy products. 97% of the farms in the U.S. are family-owned enterprises with an average herd since of 214. (U.S. Department of Agriculture)
#6. 74% of the dairy farms that were active in the U.S. had 100 or fewer dairy cows. These farms are responsible for over 86% of the milk that is brought to the market every year. (U.S. Department of Agriculture)
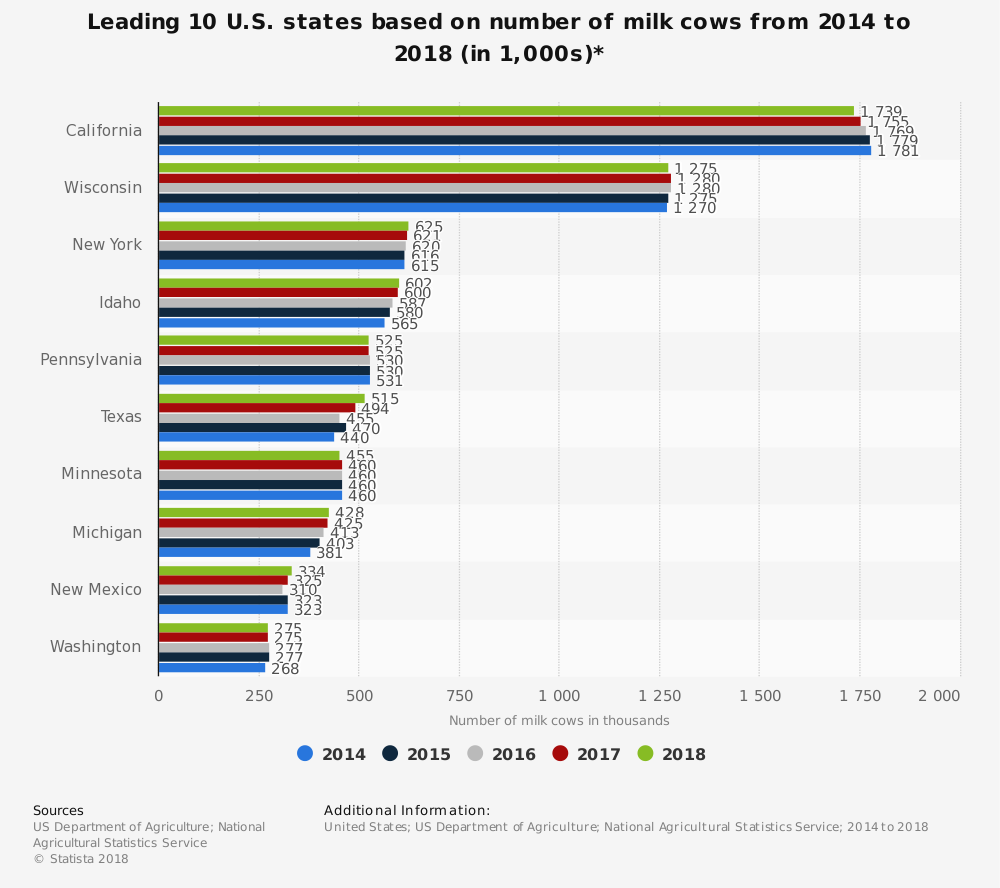
#7. Although Wisconsin is nicknamed the “Dairy State,” California leads the country in milk production, responsible for over 19% of the total market. (U.S. Department of Agriculture)
#8. Vermont leads the country in terms of dairy cow related income as a percentage of all farm income generated, at 68%. New York comes in second at 55%, followed by Wisconsin (53%), New Mexico (49%), Idaho (37%), and Pennsylvania (33%). (U.S. Department of Agriculture)
#9. More than 40 billion pounds of milk is produced in California each year by farmers working with dairy cows. Wisconsin contributes another 29 billion pounds of milk. (U.S. Department of Agriculture)
#10. Europe controls a 39% share of the global dairy product export market, thanks to their butter and cheese production capabilities. Germany exports over $4.4 billion worth of cheese annually, which translates to a 14.5% share of the global cheese market. (Statista)
#11. Global dairy cow milk production volume each year totals 500 million metric tons. More than 5.4 million metric tons of butter are produced each year. (Statista)
#12. New Zealand sells the most dairy products to the United States, with 2017 imports totaling over $590 million. Canada came in second, with over $504 million in dairy products sold. (Progressive Dairyman)
#13. Even though California leads in total milk production, it places third in the total number of dairy processors in the state. Wisconsin has the most at 202, followed by New York at 130. California has 118. (Progressive Dairyman)
#14. Colorado is the only state in the U.S. which does not have an active dairy processor. There are four states (Alaska, Virginia, Mississippi, and Missouri) which only have 1 active processor. (Progressive Dairyman)
#15. Mexico was the top recipient of U.S. dairy exports in 2017, purchasing $1.3 billion worth of products. Canada imported $636 million worth of dairy products. China came in third, with $577 million worth of exports. (Progressive Dairyman)
#16. Michigan leads the way in terms of total pounds of milk per cow, totaling 26,302 in 2017. Colorado came in second, at 26,181 pounds. They were followed by New Mexico (24,960), Arizona (24,680), and Idaho (24,378). (Progressive Dairyman)
#17. Alaska dairy farmers had the least amount of milk per cow, at just 9,667 pounds. (Progressive Dairyman)
#18. There are over 9,000 licensed dairy cow herds in Wisconsin, which leads the U.S. in total farms. Pennsylvania comes in second, with over 6,500 licensed herds. New York is in third (4,490), followed by Minnesota (3,210), and Ohio (2,380). (Progressive Dairyman)
#19. 44% of global milk production comes from southern Asia and the European Union. From 2002-2007, milk production grew by 13%, or an average of 15 million tons per year, because of increases seen in China, Pakistan, and India. (FAO)
#20. Part of the global pricing network for milk products is the placement of protective tariffs on certain products. U.S. and European tariffs range from 50% to 120%, which causes consumer prices to be as much as 150% above the global market price. (FAO)
#21. Countries that protect their dairy markets have prices often exceed $50 per 100kg, whereas non-protective countries, like Argentina, Uganda, and Uruguay, see milk prices below $20 per 100kg. (FAO)
Dairy Cow Industry Trends and Analysis
The dairy cow industry is one of the most valuable and most stable agricultural industries in the world today. From the milk that is produced, a wide variety of different products, from butter to cream to yogurt, reach global markets. Demand levels have been steadily rising for dairy products as well, which has led to price increases within the industry despite having high production levels.
From 1981 to 2005, the world market price for milk topped out at $25 per ton. In 2007, prices increased by 75%, to $45 per ton, because of scarcity within the market. Deficits in world milk production have reached 2 million tons per year because of rising demands in developing countries.
To balance out current demand levels, production would need to rise by at least 0.5%.
Despite this strength, there are some issues to consider. Dairy is a volatile industry that is affected by small changes in quantity and quality. Very few countries are self-sufficient in the number of dairy cows that are managed. As world incomes rise, expect the price of dairy to keep rising as well.
Although millions of people visit Brandon's blog each month, his path to success was not easy. Go here to read his incredible story, "From Disabled and $500k in Debt to a Pro Blogger with 5 Million Monthly Visitors." If you want to send Brandon a quick message, then visit his contact page here. Brandon is currently the CEO of Aided.