Just about any container is suitable for shipping, including wood and cardboard. The statistics for the container shipping industry are focused on the manufactured metal boxes that are used for international maritime trade. These containers may be purchased by companies involved in trade, leased, or owned by the shipping company.
The health of the container shipping industry can be used as a gauge to measure the overall global economy. When trading is up within the industry, the economies of the world are generally strong. When trade begins to decline, it can be an indication that a recession is on its way.
Many of the statistics reported by the container shipping industry are reported in TEU, which stands for “Twenty-foot Equivalent Unit.”
Important Container Shipping Industry Statistics
#1. The global container shipping industry loaded 1.720 Mt of cargo for sea-based trade involving containers in 2016. (Statista)
#2. The quantity of loaded freight for international maritime trade was 10,287 Mt of loaded cargo. (Statista)
#3. There are currently more than 5,000 container ships in the world, serving as an international merchant fleet that supports the container shipping industry. The Trans-Pacific maritime trade route is the most popular. (Statista)
#4. The average price for a single container for shipping purposes within the industry was $1,450 in 2016. That was 15% lower in value than the year before for a 20-foot equivalent container. (Journal of Commerce)
#5. The useful life of the average container is about 15 years when used for shipping purposes. Once it reaches the end of its lifespan, the average container will be sold for land-based storage for a price as low as $700. (Journal of Commerce)
#6. Seaco is currently the largest container company in the world, leasing 1.3 million containers globally. That gives the company a 15% share of the industry. (Seaco)
#7. The current capacity of container ships that are involved in maritime trade within the container shipping industry is 244 million dwt. (Statista)
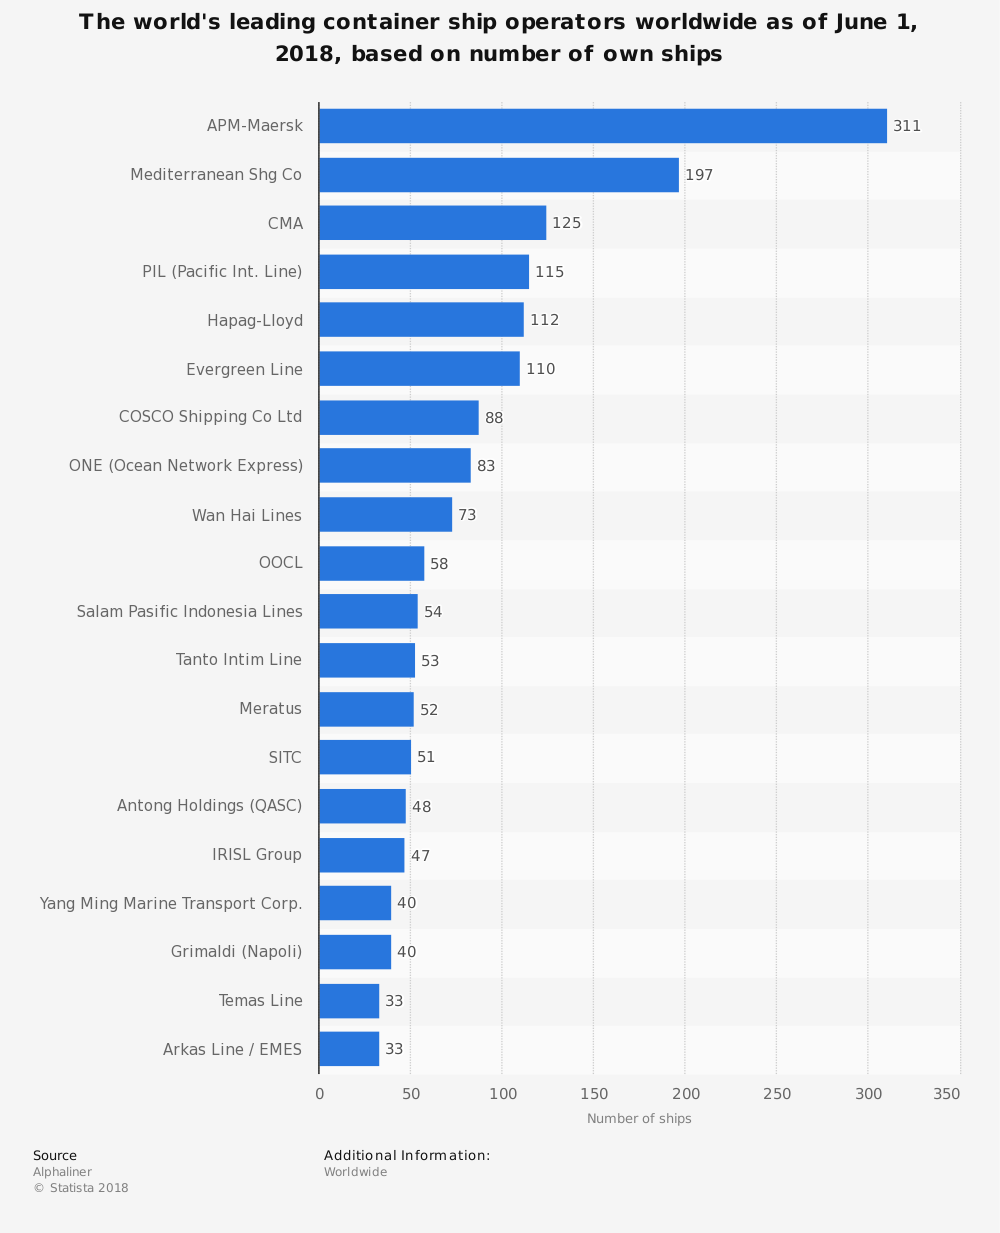
#8. Maersk is the leading container ship operator in the world today, with revenues at nearly $31 billion in 2017. They are responsible for 4.12 million TEUs each year. (Statista)
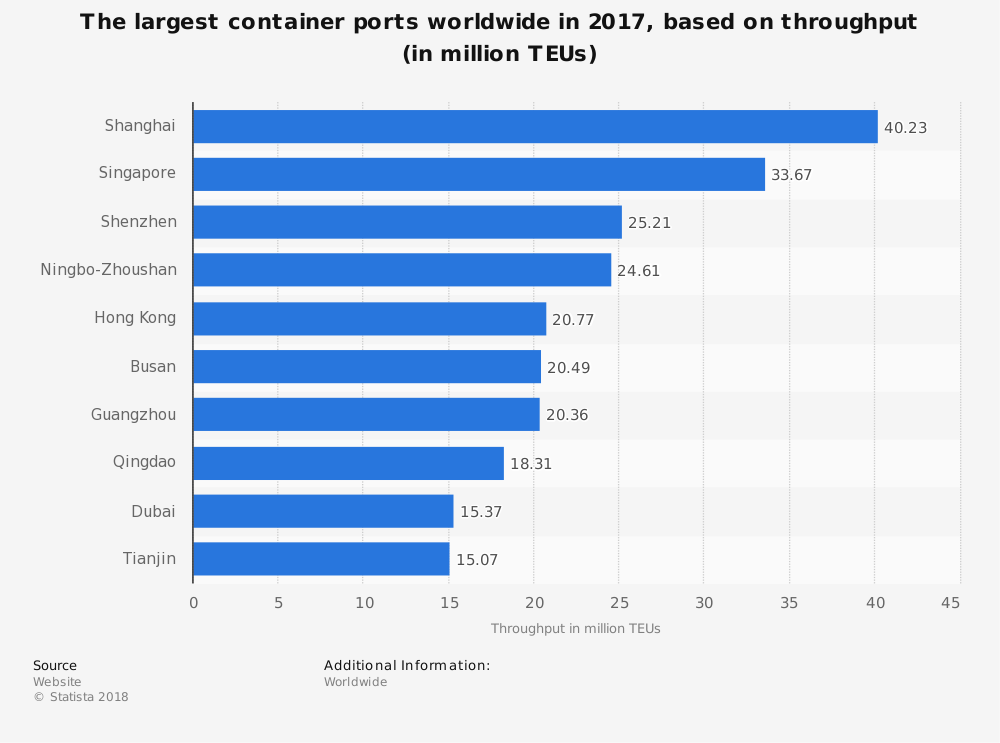
#9. Shanghai is the largest container port in the world. Their throughput, in 2016, was 40 million TEUs. In comparison, the amount of container traffic which is handled by the Port of Los Angeles is just 9.2 million TEUs. (Statista)
#10. The 5 largest providers of shipping container leases in the world account for 85% of industry revenues within their segment. (Research and Markets)
#11. If a shipping container is heavily used, its anticipated lifespan can be cut by nearly 40%, with a usable life of just 7 years. (Research and Markets)
#12. Each year, there are more than 10,000 shipping containers which are lost at sea during transport. Based on current shipping schedules, that means an average of 1 shipping container is lost per hour. (Billie Box)
#13. 95% of international cargo is transported by using maritime processes, allowing for high-volume shipping which keeps prices low. The standard container used by the industry can hold about 3,500 shoe boxes when stacked full. (Billie Box)
#14. The United States is the world’s importer of containerized cargo, receiving 19.6 million TEUs in 2014. China was in second, with 14.7 million TEUs received. They were followed by Japan (6.55 million TEUs), South Korea (5.09 million TEUs), and Indonesia (3.17 TEUs). (World Shipping Council)
#15. Germany is the largest exporter of containerized items from Europe, with 3.32 million TEUs produced in 2014. Italy was in second, with 1.83 million TEUs, then Spain at 1.72 million TEUs. (World Shipping Council)
#16. Germany is also the largest importer of containerized goods, with 3 million TEUs received in 2014. They were followed by the United Kingdom with 2.64 million TEUs, then the Netherlands at 2.22 million TEUs. (World Shipping Council)
#17. There are enough shipping containers in use by the industry today that, if they were laid back-to-back, they would be able to encompass the world twice at the equator. (Port Technology)
#18. The standard shipping container used by the industry offers a maximum gross weight of 30 tons, while the 40-foot containers offer a maximum gross weight of 32.5 tons. They have a tare weight of 2.2 tons and 3.8 tons respectively. (Billie Box)
#19. Liner ships involved with the container shipping industry are responsible for about $4 trillion in goods each year. About 60% of the value of seaborne trade is managed by liner ships. (World Shipping Council)
#20. For the average trade route or group of trade routes, there are about 500 liner shipping services available to meet current schedule demands. More than 200 countries have at least one port which is open to container ships. (World Shipping Council)
#21. The global annual capacity at ports to handle incoming containers is estimated to be around 680 million TEUs. (World Shipping Council)
#22. China is the leading exporter of containerized cargo in the world today, with 36 million TEUs produced in 2014. The U.S. was in second (11.9 million TEUs), followed by South Korea (5.93 TEUs) and Japan (5.28 TEUs). (World Shipping Council)
Container Shipping Industry Trends and Analysis
International shipping is never going away. Since the beginnings of human culture, we have traded with one another to improve our standard of living. This process occurs at a larger scale than ever before thanks to the container shipping industry. With thousands of containers loaded on ocean-going vessels each day, this industry will continue to thrive, even when the economics of it may be challenging.
There are disruptors in this industry which are looking to change how profits are generated. Although these companies are relatively small, they could create revenue issues if they are able to scale upward. Look for companies to seek out merger opportunities, or acquire these disruptors outright, if the revenue pictures begin to grow cloudy.
Although the industry may face the occasional challenge, the demand for container shipping is steadily growing. That means this industry is forecast to grow by an average rate of about 4% over the next 5-year period.
Although millions of people visit Brandon's blog each month, his path to success was not easy. Go here to read his incredible story, "From Disabled and $500k in Debt to a Pro Blogger with 5 Million Monthly Visitors." If you want to send Brandon a quick message, then visit his contact page here. Brandon is currently the CEO of Aided.