The first corrugated box was produced in the United States in 1895. In the span of just 10 years, almost all of the wooden crates or boxes that were being used for various purposes were replaced with corrugated cartons. By 1908, corrugated cardboard and paper-board were used interchangeably by the industry.
Corrugated boxes provide a number of advantages. You can print on the exterior material. They are durable enough to withstand standard shipping processes. Modern corrugated boards can be provided in several color varieties, graphics options, and box designs.
Important Corrugated Box Industry Statistics
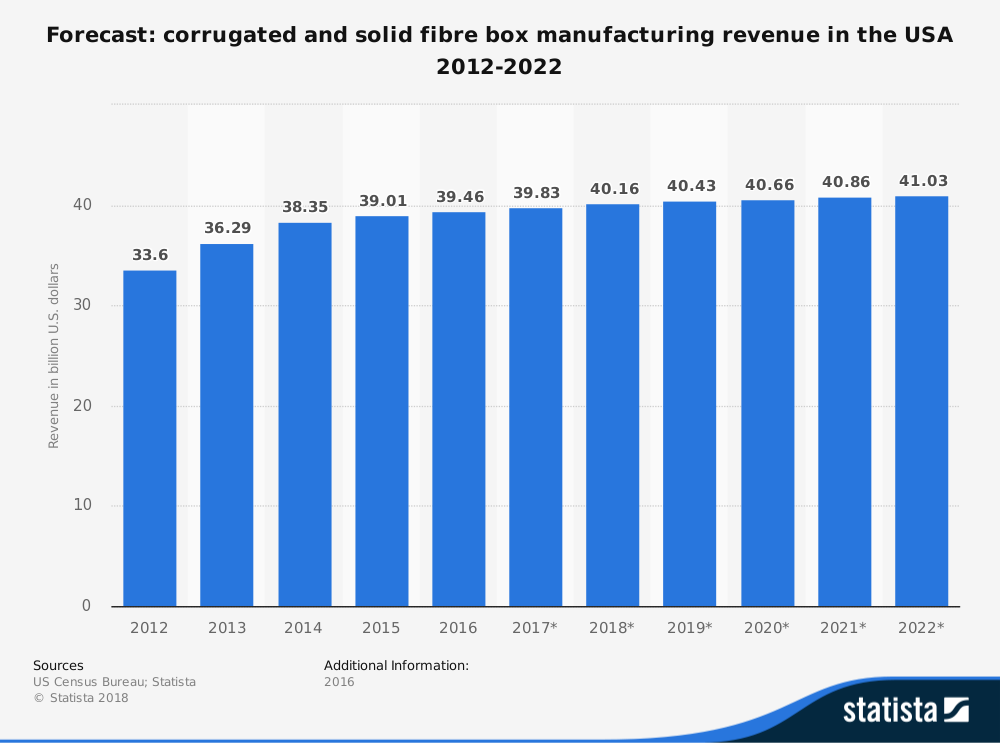
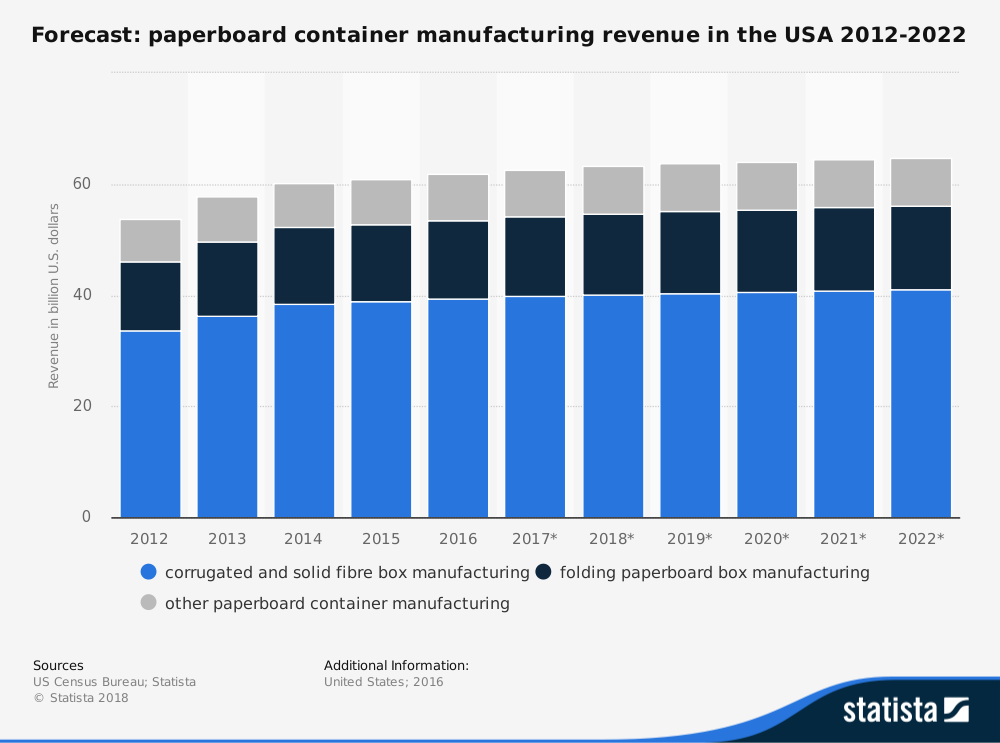
#1. Container manufacturing and cardboard box manufacturing in the United States is an industry currently valued at $66 billion. (IBIS World)
#2. From 2013-2018, the corrugated box industry grew at an average annual rate of 1%. (IBIS World)

#3. About 2,000 businesses are currently active within the corrugated box industry in the United States. These firms are responsible for the direct employment of more than 141,000 people. (IBIS World)
#4. The four largest manufacturers of corrugated boxes, cardboard, and shipping containers hold a 33.1% share of the industry. West-Rock holds the largest market share, at 12.3%. (IBIS World)
#5. In 2016, corrugated industry shipments rose by 2.1%, reaching over 376 billion square feet. (Advance Packaging Corporation)
#6. 80% of the shipments generated by the industry originate from corrugator plants. The remainder of shipments for the corrugated industry come from sheet plants. (Advance Packaging Corporation)
#7. The total value of industry-related shipments in 2016 was $30.8 billion. (Advance Packaging Corporation)
#8. 31% of corrugated box manufacturing products are consumed by the food manufacturing industry. In second is wholesale trade, at 16%. These industries are followed by paper manufacturing (9%), agriculture, forestry, and fishing (8%), and beverage manufacturing (6%). (Numera/FBA)
#9. IP holds 32% of the current American capacity for corrugated manufacturing, producing more than 12.6 million tons per year. West-Rock, which leads in market share, holds 18% of the industry’s total capacity. (Alternative Paper Solutions)
#10. The corrugated box industry has been rapidly consolidating since 2007, when there were 806 sheet plants and 554 corrugator plants in operation. In 2016, there were 690 sheet plants and 465 corrugator plants. (Fibre Box Association)

#11. Domestic consumption of Kraft liners has remained relatively steady since 200, with about 15.5 million tons consumed in the U.S. each year. The same is true for recycled liners, with 5.5 million tons consumed each year. (Fibre Box Association)
#12. Although the number of corrugator plants has decreased by nearly 200 since 1992, the total production levels have risen by over 500 million square feet in total yearly production at the same time. (Fibre Box Association)
#13. In 2016, paper mills in the United States averaged higher than 95% operating rates, thanks to strong levels of demand and higher pricing structures. (Advance Packaging Corporation)
#14. In July 2017, medium mills within the corrugated box industry achieved an operating rate of 99.4%. For 2018, the projected operational rate is expected to be above 97%. (RISI Info)
#15. The mill cost per ton for medium production is $325 for virgin materials and $351 for recycled materials. For liner production, the cost per ton is $328 for Kraft and $362 for recycled. (Advance Packaging Corporation)
#16. Inventory levels in Q4 2016 (2.3 million tons) reached the lowest levels since Q3 2012, when there were 2.1 million tons of inventory available. (Fibre Box Association)
#17. Asia leads the world in total corrugated production and shipments, with more than 120 billion square meters produced in 2017, or 52.8% of the market. Europe is the second-leading producer, with nearly 6 billion square meters (22.2% of the market) produced and shipped. (International Corrugated Case Association)
#18. 40% of the corrugated boxes produced in Japan are used for processed foods. This is followed by fruits and vegetables (10.8%), electrical appliances (7.6%), pharmaceuticals (6.1%), and ceramics (5.5%). (Statista)
#19. Just 1.1% of the corrugated boxes which are manufactured each year are used for a purpose other than packaging. (Statista)
#20. 34% of the global packaging industry is dedicated to paper and board products. (Ernst and Young)

Corrugated Box Industry Trends and Analysis
With online sales increasing, production levels rising, and several new plants beginning operations between 2018-2024, the corrugated box industry looks poised for rapid growth. Although only 3 projects are deemed to be “certain” additions to the industry in the United States, the improved capacities and innovative production methods will keep production levels above 1 billion square feet for the foreseeable future.
Improved pricing structures within the industry will continue to help revenues grow as well. Using 1987 as a base year for a price index of 100, in 2016, the industry achieved a price index of 168.2. Since 2008, the price index has been above 140, according to data provided by the Fibre Box Association industry annual report.
Nothing on the economic horizon points to a reduction in the need for corrugated boxes. Even in times of recession, this product is used by domestic and international organizations in a variety of ways. Households will still need access to food and beverage products, which make up nearly 40% of total industry revenues.
A strong economy means a strong push for new revenues by the corrugated box industry. A weaker economy means stable revenues. That’s a win/win situation for everyone involved with the industry.
Although millions of people visit Brandon's blog each month, his path to success was not easy. Go here to read his incredible story, "From Disabled and $500k in Debt to a Pro Blogger with 5 Million Monthly Visitors." If you want to send Brandon a quick message, then visit his contact page here. Brandon is currently the CEO of Aided.
