The Asia chemical industry is led by the China Petroleum and Chemical Industry Federation, or CPCIF. The CPCIF is a social intermediate organization with a nationwide presence in China that manages the services produced by the chemical industry. It runs independently, as dictated by its charter, and is designed to be a service-orientated industry that looks to strengthen cooperation with its global counterparts.
Much of the Asia chemical industry is still young. Many locations are operated by small- to medium-sized businesses, which makes it difficult for the industry to compete on a larger scale. There is also a dependence in purchasing the raw materials instead of having them be obtained within the industry itself, which creates domestic similarities that are difficult for consumers.
Important Asia Chemical Industry Statistics
#1. Total global chemical shipments have a value of $5 billion. The Asia chemical industry is highly dependent upon imports, which typically originate from the United States, Germany, or Saudi Arabia. (Statista)
#2. In 2016, the chemical industry in China generated revenues of RMB 13.3 trillion, which was 11.5% of all sales revenue for industrial enterprises of its size. (A.T. Kearney)
#3. More than 20 sub-sectors have been developed within the Asia chemical industry to date, creating a comprehensive portfolio of services that are supported by the largest production capacity in the world. (A.T. Kearney)
#4. The chemical sector in China ranked first in all industrial sectors for operating income, at RMB 12 trillion, and trade, at RMB 2.4 trillion. (A.T. Kearney)
#5. There are currently 4 refinery facilities with a total output of 20 million tons annually operating in the Asia chemical industry today. There are 9 facilities with a total output above 1 million tons per year. There are also 381 chemical parks that are above the designated size of a standard facility. (A.T. Kearney)
#6. From 2012-2016, the Chinese chemical market grew at a CAGR of 9.4%. The commodity chemical market grew at a CAGR of 9.3%, while the specialty chemical market grew at a CAGR of 7.1%. (A.T. Kearney)
#7. The sector with the largest levels of growth from 2012-2016 was the agrochemical market in Asia, with a CAGR of 14.9%. (A.T. Kearney)
#8. In 2016, China completed a total of RMB 88 billion in outbound chemical investments. Another RMB 394 billion in outbound deals, at the time of publication, were still being negotiated. (A.T. Kearney)
#9. From 2010-2016, outbound chemical investments grew at a rate of 80% within the Chinese chemical industry. 48 companies completed a total of RMB 189 billion in outbound investments during that time period. (A.T. Kearney)
#10. In 2015, Asia received 31% of the foreign direct investment directed globally to the chemical industry for inflows and 23% of total FDI outflows. (UNCTAD)
#11. The Chinese chemical industry is responsible for almost 10% of China’s total GDP each year. (Economy Watch)
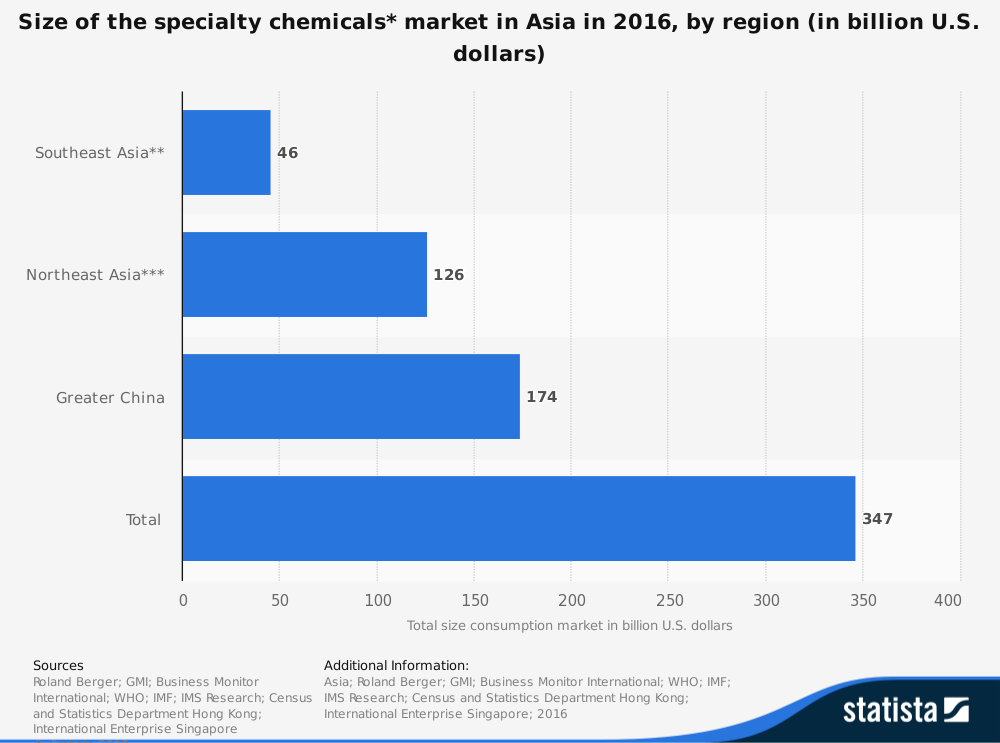
#12. The Chinese chemical industry accounts for 52.1% of the Asia-Pacific chemical industry’s total value. That makes China the second-largest consumer of basic chemical products, behind the United States. (KPMG)
#13. In 2010, the Chinese chemical industry exceeded the total output value found in the U.S. chemical industry for the first time, achieving a value of CNY 5.23 trillion compared to the U.S. value of CNY 4.7 trillion. (KPMG)
#14. Multinational companies, despite their overall lack of presence within the industry, still hold an approximate 25% share of the market. (KPMG)
#15. The Asia chemical industry is the world leader in terms of ethylene production. More than 30 million ton of production comes from Asia, compared to the 25.3 million tons which originates from the United States. (KPMG)
#16. More than 2,000 firms are currently engaged in the agrochemical segment within the Asia chemical industry. (KPMG)
#17. China is currently the largest consumer of polycarbonates in the world, accounting for over 30% of global demand. It is also the largest consumer of polyurethanes, accounting for over 20% of the global demand. (KPMG)
#18. Production of propylene from coal within the Chinese chemical industry is listed at 500,000 tons per year. Olefin production from coal is listed at 600,000 tons per year. The production of ethylene is listed at 1.5 million tons per year from various sources. (Flanders Investment and Trade)
#19. The Asia chemical industry does not have any segments operating at 80% or higher. Only areas of sodium carbonate, urea, diammonium hydrogen phosphate, and sodium hydroxide are above 80% capacity. (Flanders Investment and Trade)
#20. Chemical fertilizers have risen by 6.5% in total volume, reaching 37.06 million tons, during the first half of 2015. Ethylene production rose to 8.45 million tons over the same period, an increase of 2.3%. Synthetic materials increased to 59.7 million tons, which was a rise of 9%. (Flanders Investment and Trade)
#21. In 2015, the value of imports to China’s petroleum and chemical industry decreased by over 28%, to a total value of $175.6 billion. (Flanders Investment and Trade)
Asia Chemical Industry Trends and Analysis
The Asia chemical industry has seen high levels of growth over the past decade. As the Chinese economy begins to slow down, the amount of growth experienced by the industry is expected to slow as well. The commodity segment, which is the largest for the industry, is expected to grow at a CAGR of 5.9% over the next 5-year period, ending in 2023.
The agrochemicals segment will continue to see stronger growth than other segments, with a forecast 8.6% CAGR.
What makes life difficult for this industry is that its fixed costs are quite high. Although it has the highest levels of installed capacity in the world, the Asia chemical industry does not have the expertise or efficiencies that benefit other markets. There are only a handful of large, multi-national corporations currently operating within the Asian sector. That means pricing does not occur at the same levels of scale.
Consumers in Asia also find that differentiation between commodity chemicals is minimal at best, which makes it more common to switch brands over time domestically than in other markets.
There are still plenty of opportunities to be found in this market. As it grows and establishes its own identity, expect stronger levels of growth to begin appearing in the next 10-20 years.
Although millions of people visit Brandon's blog each month, his path to success was not easy. Go here to read his incredible story, "From Disabled and $500k in Debt to a Pro Blogger with 5 Million Monthly Visitors." If you want to send Brandon a quick message, then visit his contact page here. Brandon is currently the CEO of Aided.