In the United States alone, almost 70% of all households own at least one pet. The actual number is up 12% in the last 15 years, as in 1998 56% of households in the U.S. owned a pet. Although a natural increase in this industry comes with more households have more pets, the increase in revenues has far outpaced the increase in pet ownership.
Interesting Facts About the Pet Industry
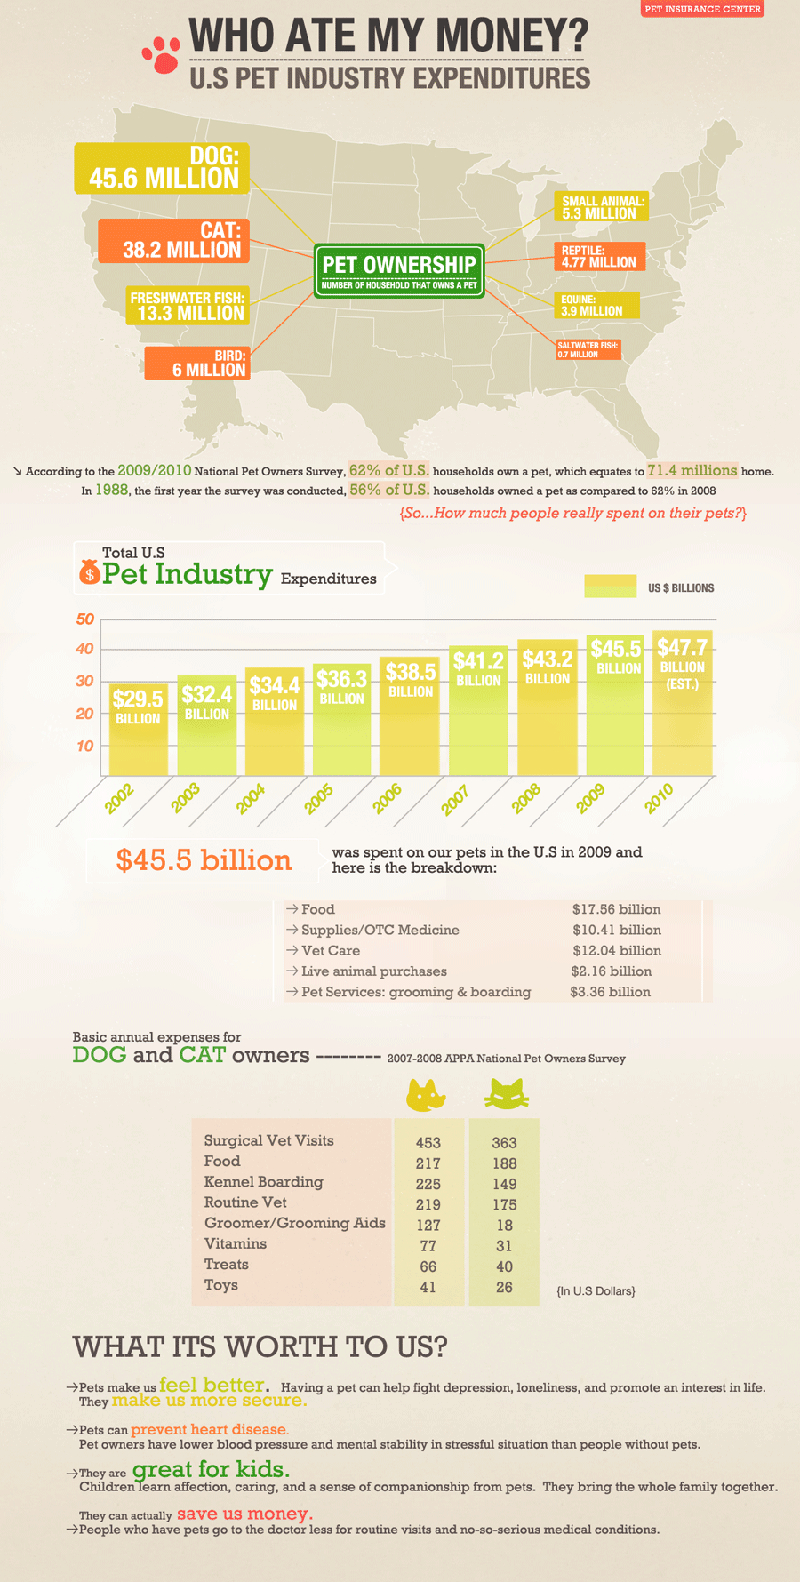
In 2013, $55.72 billion was spent on pets in the United States alone.
The biggest expenditure that pet owners face, by far, is the purchase of food for their pets. Over $21 billion of the revenues generated by this industry came from the purchase of food. Although there are more freshwater fish owned than any other pet, the fish isn’t the most common pet seen in households. That honor belongs to man’s best friend, the dog, who has a place in over 56% of American homes.
Essential Statistics
1. Outside of food costs, pet owners spend more on veterinary care for their pets than anything else, a total that exceeded $14 billion in 2013.
2. The annual routine veterinary visit for a dog in 2013 was $231. For cats, the second most popular pet in households today, the average cost was $193.
3. The least popular pet listed in the data is a horse, although 2.8 million people say they owned a pet horse and over 8 million horses are currently listed as “pets” in the U.S.
Takeaway: Pets provide a unique level of kinship that some people just can’t get with other relationships. After a difficult day at work, having a four legged furry friend come up and snuggle with you is a lot more rewarding than having someone telling you that the dishes need to be washed and the laundry folded! Pets also bring a certain level of responsibility with them that helps to give people confidence, have more laughs, and just generally enjoy life more, which is likely why pet ownership rates are climbing.
Other Interesting Facts
1. 32% of dog owners say that they take their dogs with them when they are away from home for more than two nights.
2. Cat owners spend more on vitamin supplements [$77/year] for their pets than dog owners [$64] spend.
3. Over 90% of all pet stores in the U.S. that sell retail products are independently owned and employ fewer than 4 people.
4. The biggest gains in growth within the pet industry are from mass market retailers, who have commonly placed sales on pet products to entice other purchases.
5. Pet ownership rates are expected to rise 2.2% each year through 2018.
6. Revenues from rising pet ownership rates are expected to rise over 4% per year through 2018.
7. Since 2008, the actual number of pet stores has remained virtually static.
Takeaway: The costs of owning a pet are rising because overall ownership rates are rising while suppliers remain static. This creates a natural inflation rate that pet owners will simply have to adjust to paying if they want to keep their pets. This rise in revenues, however, will also equate to more job opportunities as entrepreneurs see the value in having a stake within this growing industry.
Although millions of people visit Brandon's blog each month, his path to success was not easy. Go here to read his incredible story, "From Disabled and $500k in Debt to a Pro Blogger with 5 Million Monthly Visitors." If you want to send Brandon a quick message, then visit his contact page here.