Social Networking Addiction Statistics
As estimated 350 million social media users suffer from Facebook addiction syndrome. This has become more prominent in users between the ages of 16-25. An estimated 60% of addicts are females with 68% of users confessing to checking their social media feeds 10 times a day. Additional social media statistics are listed below that illustrate the power of social media in today’s time.
• If compared to the size of a country, Twitter would be the 12th largest in the world.
• LinkedIn signs 2 new members up every second.
• The average visitor spends 15 minutes a day on YouTube.
• 3 million blogs are launched each month.
• 97% of Pinterest users are female.
• 5 million images are uploaded daily on Instagram.
• The Google +1 button is pressed 5 billion times a day.
• Facebook dominates the social landscape with a 63% market penetration.
How Social Media Users Spend Their Time
3 hours a day on average is spent on social media for users age 15-19. Two full hours are spent interacting daily for users age 20-29. The most popular place that users check their feeds are in bed with 66% of users doing so while under the covers.
• 31% of adolescents freely admit to reading and writing on a social media site while sitting on the toilet.
• 45% of users check their timeline while eating.
• 37% of students admitted that their social media updates were more interesting than a classroom lecture.
• 55% of youth check their social media site on a mobile device versus a desktop or laptop.
Social Media Addiction
A discussion on the addiction of social media with its users.
Social Media at Work
1. The average American spends 24% of their day cyberloafing, spending 23 minutes to regroup.
2. 60-80% of people’s time on the internet at work have nothing to do with work.
3. If 1,000 employees spent 1 hour each day cyberloafing, the company could lose $35 million a year.
User Trends by Category
Facebook and Twitter
1. 18% of users can’t go a few hours without checking Facebook.
2. 61% of users have to check Facebook at least once a day.
3. 16% of people rely on Twitter or Facebook for their morning news.
iPhone Users
1. 28% of iPhone users check Twitter before they get out of bed.
2. 26% of users check Twitter before they turn on the television.
3. 23% of users rely on Twitter for the morning news.
Social Media Addiction Statistics
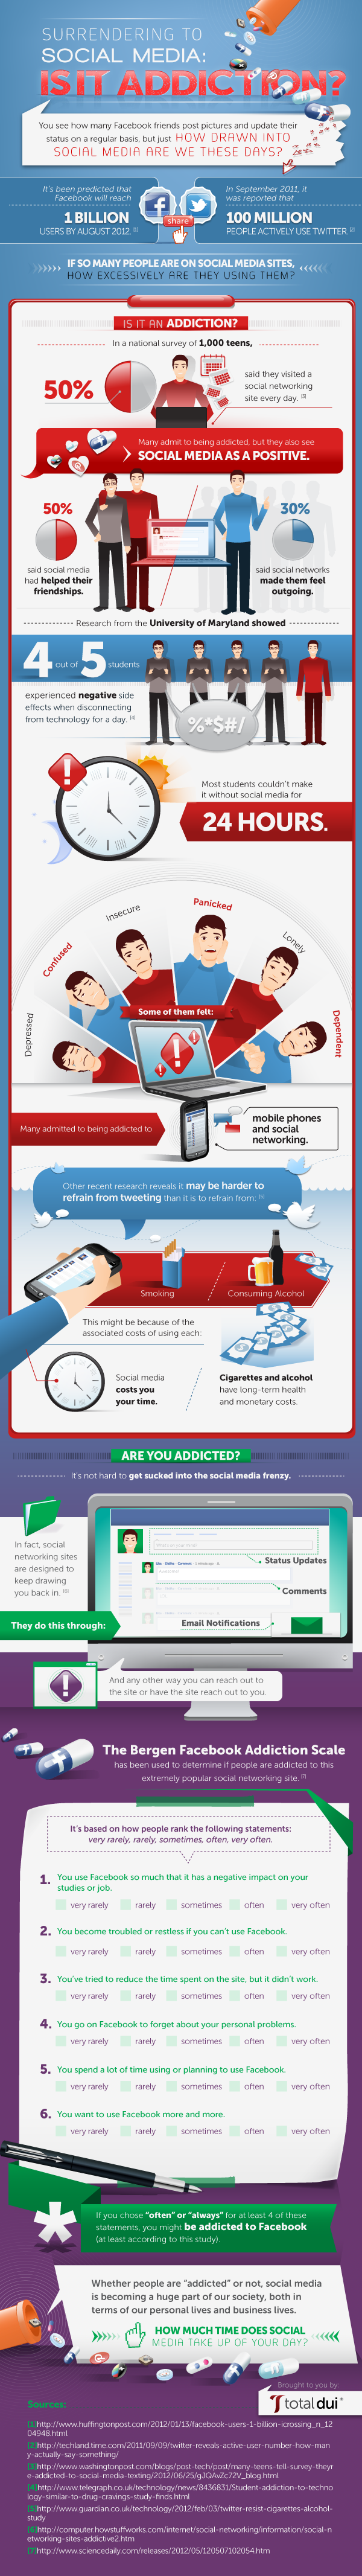
The following infographic outlines statistics and trends for the most popular social media sites. An average 4 out of 5 students find that they experience negative side effects if they feel disconnected from technology for a day. This leads to the fact that most students could not go without social media for 24 hours.
Although millions of people visit Brandon's blog each month, his path to success was not easy. Go here to read his incredible story, "From Disabled and $500k in Debt to a Pro Blogger with 5 Million Monthly Visitors." If you want to send Brandon a quick message, then visit his contact page here. Brandon is currently the CEO of Aided.