Bicycle Industry Statistics and Trends
According to the Gluskin Townley Group, there are approximately 4,256 speciality bike stores, lowered almost 1,000 stores from the year before. 87% of store fronts are just a single location. A quarter of shops have seen an increase in revenue while more than half have seen a decrease. The market is broken down into the follow statistics.
Percentage of Revenue by Category
1. Bikes – 41%
2. Parts and Accessories – 26%
3. Repairs – 16%
4. Apparel – 7%
5. Other – 10%
Percentage of Market Channels
1. Family Bike Shop – 87.8%
2. High End Road – 31.45
3. High End Mountain Bike – 24.4%
4. BMX/Freestyle – 15.7%
5. Urban All Brands – 11.8%
6. Womens Bike Shop – 9.8%
7. Custom Boutque – 4.9%
8. Other – 18.6%
Percentage of bike sale shares by category
1. Mountain Bike – 24%
2. Hybrid/Cross – 21%
3. Road – 20%
4. Comfort – 15%
5. Youth – 13%
6. Cruiser – 6%
7. Recum/Tandem – 1%
Bicycle Technology
The below video demonstrates the technology of a bicycle that does not use a common chain or crank, but instead a stepping power of a single gear that can boost three tomes the power.
Top 10 Selling Brands
1. Trek
2. Giant
3. Raleigh
4. Haro
5. Specialized
6. Fisher
7. Redline
8. Cannondale
9. Diamondback
10. Electra
Average Salary in Bicycle Industry
Store Owner – $44,000
Manager – $33,000
Sales/service Manager – $29,000
Mechanic – $20,000
Additional Bicycle Shop Services
The following list outlines additional services offered by speciality bicycle retailers.
1. Bike Rentals – 40.1%
2. Training – 12.9%
3. Coffee Bar – 12.2%
4. Spinning Classes – 10.8%
5. Coaching – 9.8%
6. Beer – 4.5%
7. Electric Trainer Time and Rental – 3.8%
8. Cafe – 0.7%
9. Full Service Restaurant – 0.7%
10. Massage – 0.7%
11. Yoga – 0.7%
12. Juice Bar – 0.3%
13. Other – 12.9%
Rider Statistics
Male Frequency of Riding
Frequent – 16%
Occasional (25-99 days) – 46.6%
Infrequent (6-24 days) – 37.4%
Female Frequency of Riding
Frequent – 11.1%
Occasional (25-99 days) – 47.8%
Infrequent (6-24 days) – 41.1%
Gender and Age
Female
19.1 million
49% of industry
Average age is 34.2 years old.
Male
20.2 million
51% of industry
Average age is 35.5 years old.
Youth Group
Age 17 and younger – 10.8 million
28% of total industry.
Adult Group
Age 18 and older – 28.5 million
72% of total industry.
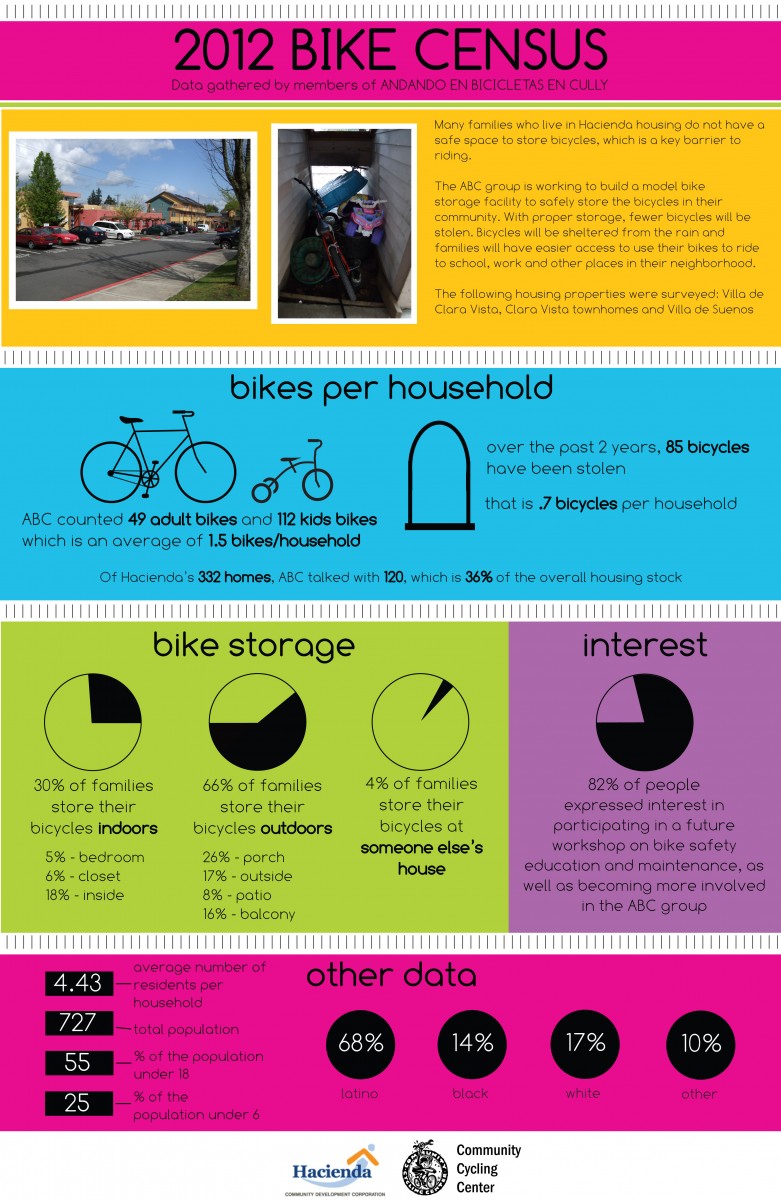
Bike Census
According to the below infographic, 82% of Americans express interest in participating in a workshop on bike safety, education, and maintenance. An average .7 bicycles are stolen per household. Additional statistics for the bike industry are outlined below.
Although millions of people visit Brandon's blog each month, his path to success was not easy. Go here to read his incredible story, "From Disabled and $500k in Debt to a Pro Blogger with 5 Million Monthly Visitors." If you want to send Brandon a quick message, then visit his contact page here. Brandon is currently the CEO of Aided.