Furniture Industry Statistics
The furniture industry is broken down into retail stores, office furniture merchants, warehouse showrooms, and specialty furniture. According to the US Census Bureau, there are approximately over 87,000 establishments bringing in annual revenue of $120 million a year and employing more than 500,000 employees. The total market size of the furniture industry, accounting for related accessories, floor coverings, and draperies operate within a $30 billion dollar industry. The value of all furniture and furnishing store sales in the United States net at $106.78 billion dollars.
Market Shares of Sales Channels
The following list illustrates the market share of the different sales channels within the furniture industry.
1. Co-Operative Furniture Retailers – 63%
2. Independent Furniture Retailers – 15%
3. BBO/PBS Specialized Retailers – 5.3%
4. Mail Order Companies – 4.3%
5. Building Materials Market – 3.5%
6. Direct Sales/Craftsmen – 3.4%
7. Non Furniture Retailers – 3.2%
8. Wholesale – 2.3%
Suppliers of the US Market
The following list of countries notably supply the US furniture market. Their industry value is outlined below.
1. China – $7.6 billion
2. Canada – $1.8 billion
3. Italy – $848 million
4. Mexico – $829 million
5. Vietnam – $658 million
6. Malaysia – $658 million
7. Indonesia – $562 million
8. Thailand – $391 million
9. Brazil – $378 million
10. Taiwan – $293 million
Top Global Furniture Wholesalers
The following value of global furniture imports and market change illustrate the current trends of trading within the furniture industry.
1. China – $6.5 billion (+16.7%)
2. Canada – $1.3 billion (-5.0%)
3. Italy – $526 million (-21.9%)
4. Mexico – $653 million (+5.3%)
5. Malaysia – $566 million (+9.5%)
6. Vietnam – $604 million (+25.4%)
7. Indonesia – $449 million (+4%)
8. Thailand – $266 million (-7.8%)
9. Brazil – $218 million (-25.5%)
10. Taiwan – $200 million (-13.2%)
Handcrafted Furniture Market
A video on the handcrafted furniture market in the United States.
Industry Competition with China
As the statistics show, China has become a prominent worldwide player within the furniture industry. The main factors that give this nation a competitive edge are listed below.
• Low cost labor.
• Leading edge woodworking machinery.
• Leading edge finishing lines.
• Access to popular raw materials.
Consumer Demand
The top of the list of furniture in demand by consumers is listed below.
1. Cabinets and Shelves for the Living Room – 17.48%
2. Upholstery – 17.48%
3. Cabinets for the Bedroom – 15.35%
4. Bed or Mattress – 14.07%
5. Kitchen – 9.38%
6. Bathroom Furniture – 11.3%
7. Garden Furniture – 5.12%
8. Children Furniture – 5.97%
9. Home Office – 3.84%
The Importance of Solid Wood Furniture
Very Important – 42.07%
Less Important when Quality is OK – 52.93%
Pricing of Furniture
Looks at Price as Factor – 75.59%
Does not Look at Price – 24.41%
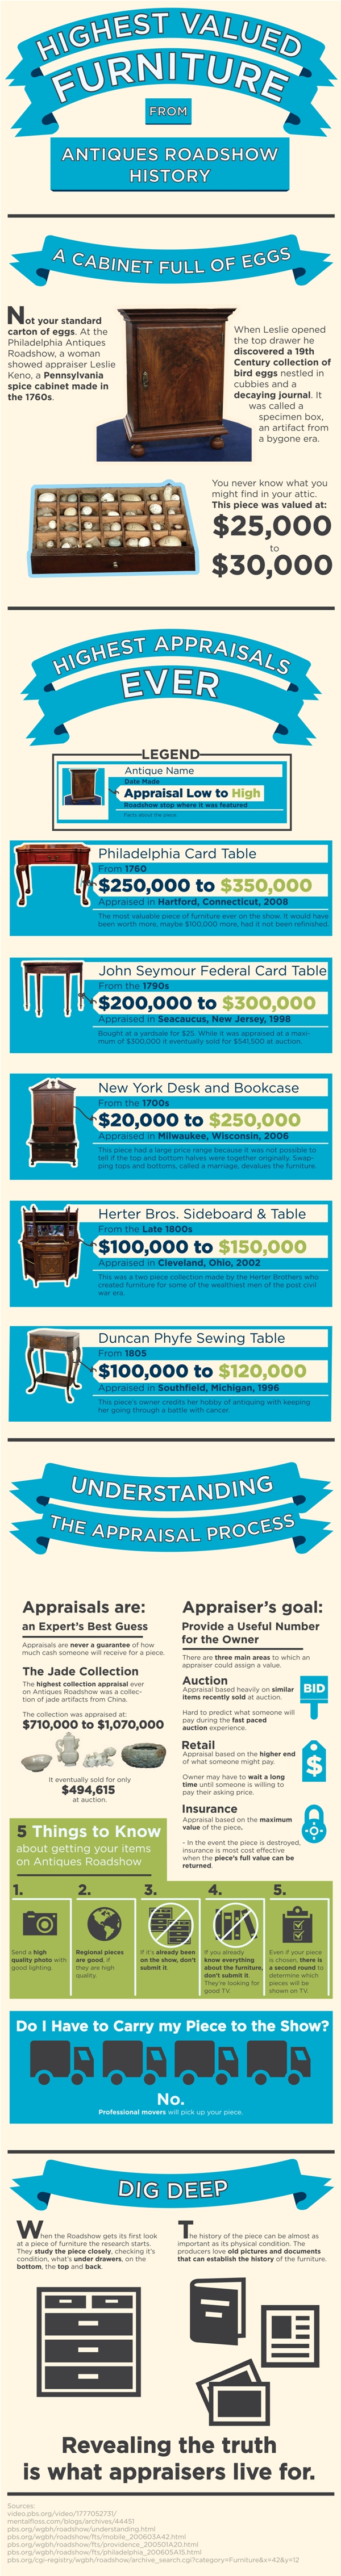
Highest Valued Furniture
The antique roadshow is a known show that travels to appraise some of the most notably highest valued pieces of furniture. The highest appraised piece of furniture was the Philadelphia card table from 1760, valued at approximately $300,000.
Although millions of people visit Brandon's blog each month, his path to success was not easy. Go here to read his incredible story, "From Disabled and $500k in Debt to a Pro Blogger with 5 Million Monthly Visitors." If you want to send Brandon a quick message, then visit his contact page here. Brandon is currently the CEO of Aided.