Nike Sales Statistics
The fourth quarter for Nike, Inc. in 2012 ended up being their largest revenue quarter in history. With a 23% increased in inventories from the previous year, the following statistics show the recent financial health of Nike, Inc.
Nike Sales Overview
– Footwear net revenue: $1.2 billion.
– Athletic footwear sales for basketball wholesale – $90 million
– Footwear sales in emerging markets – $1.2 billion
– Global market share in athletic footwear – 26.80%
Nike CEO Leadership
A comparison of the Nike CEO to the success seen with Steven Job’s branding of Apple.
2012 Income Statement Review
Revenues – 12% increase to $6.5 billion.
Gross Margin – Declined to 42.8% due to increasing product costs.
Selling and Administrative Expenses – Increased 12% to $2 billion.
Other Expenses $38 million, primarily accounting towards their brand restructuring in Western Europe.
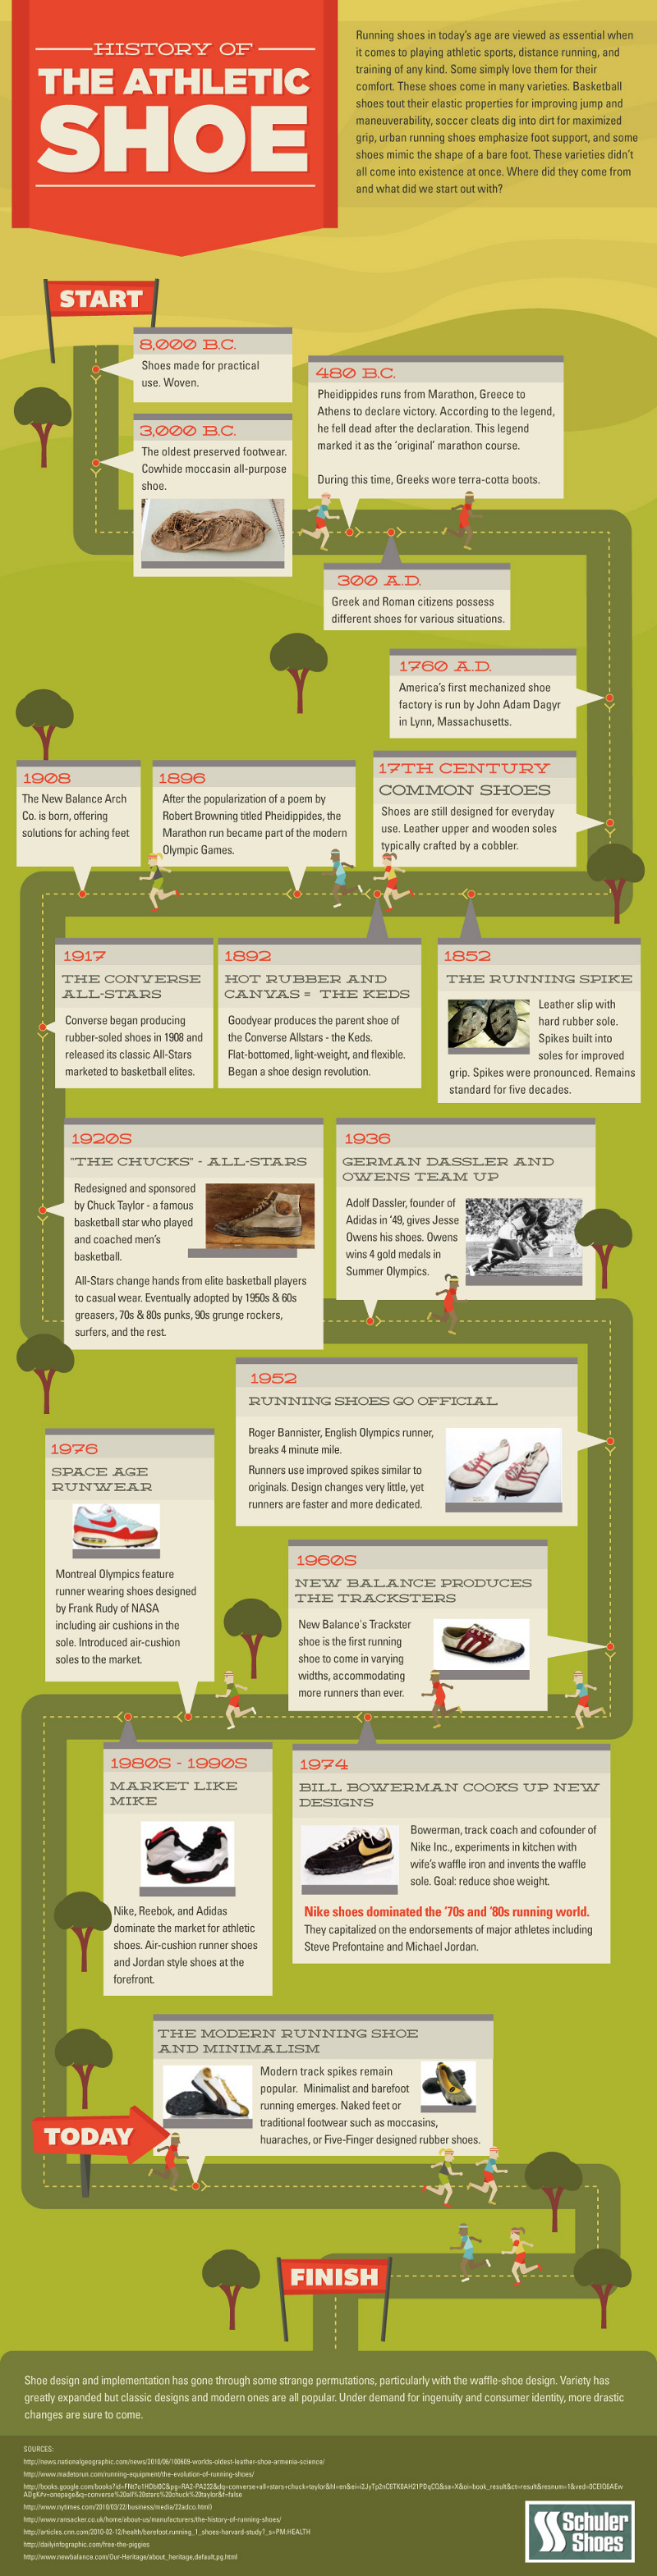
History of the Athletic Show
The following infographic takes a look at the history of the athletic shoe with the first woven shoe dating back to 8,000 B.C.
Although millions of people visit Brandon's blog each month, his path to success was not easy. Go here to read his incredible story, "From Disabled and $500k in Debt to a Pro Blogger with 5 Million Monthly Visitors." If you want to send Brandon a quick message, then visit his contact page here.