Average Income of a US Household
Approximately 15% of Americans are living in poverty, equating to 46.5 million Americans. In present time, the income level has decreased 8.3% where it was in 2007. Since 1967, lower and middle class Americans have only seen a 19% income rise while those in the top 5% have seen a 67% increased. This rising inequality in wealth is not a positive sign for social stability.
Richest and Poorest Cities in America
Based on the median income, population, unemployment rate, and poverty rate of these areas, a listing of the top 5 richest and poorest cities in America is outlined below.
Top 5 Richest Cities
1. San Jose-Sunnyvale-Santa Clara: $90,737
2. Washington DC-Arlington-Alexandria, Virginia: $88,233
3. Bridgeport-Stamford-Norwalk, Conneticut: $79,841
4. San Francisco-Oakland-Fremont, California: $74,922
5. Boston-Cambridge-Quincy, Massachusetts: $71,738
Top 5 Poorest Cities
1. Brownsville-Harlingen, Texas: $30,953
2. Dalton, Georgia: $32,858
3. McAllen-Edinsburg-Mission, Texas: $33,761
4. Gadsden, Alabama: $34,264
5. Lake Havasu City-Kingman, Arizona: $34,445
Average Income Levels by Ethnicity
1. Asians – $68,600
2. Whites – $57,000
3. Hispanics – $39,000
4. Blacks – $33,300
Is the American Dream a Myth
A discussion of how income inequality is killing the American Dream and the notion that everyone has the same opportunity to achieve it.
Average Income by Gender
– Women: $37,791
– Men: $49,398
– Female to Male Earnings Ratio: 77%
Average Income Rates by Age
1. 15 to 24 years old: $31,000
2. 25 to 34 years old: $52,000
3. 35 to 44 years old: $63,000
4. 45 to 54 years old: $68,000
5. 55 to 64 years old: $59,000
6. 65 years and older: $34,000
Real Median Income Peak Years
The following statistics outline the peek years and income level based on age groups.
1. 15 to 24 years old: 2000 at $37,129
2. 25 to 34 years old: 2000 at $59,219
3. 35 to 44 years old: 2000 at $71,683
4. 45 to 54 years old: 1999 at $78,410
5. 55 to 64 years old: 2007 at $63,549
6. 65 years and older: 2012 at $33,848
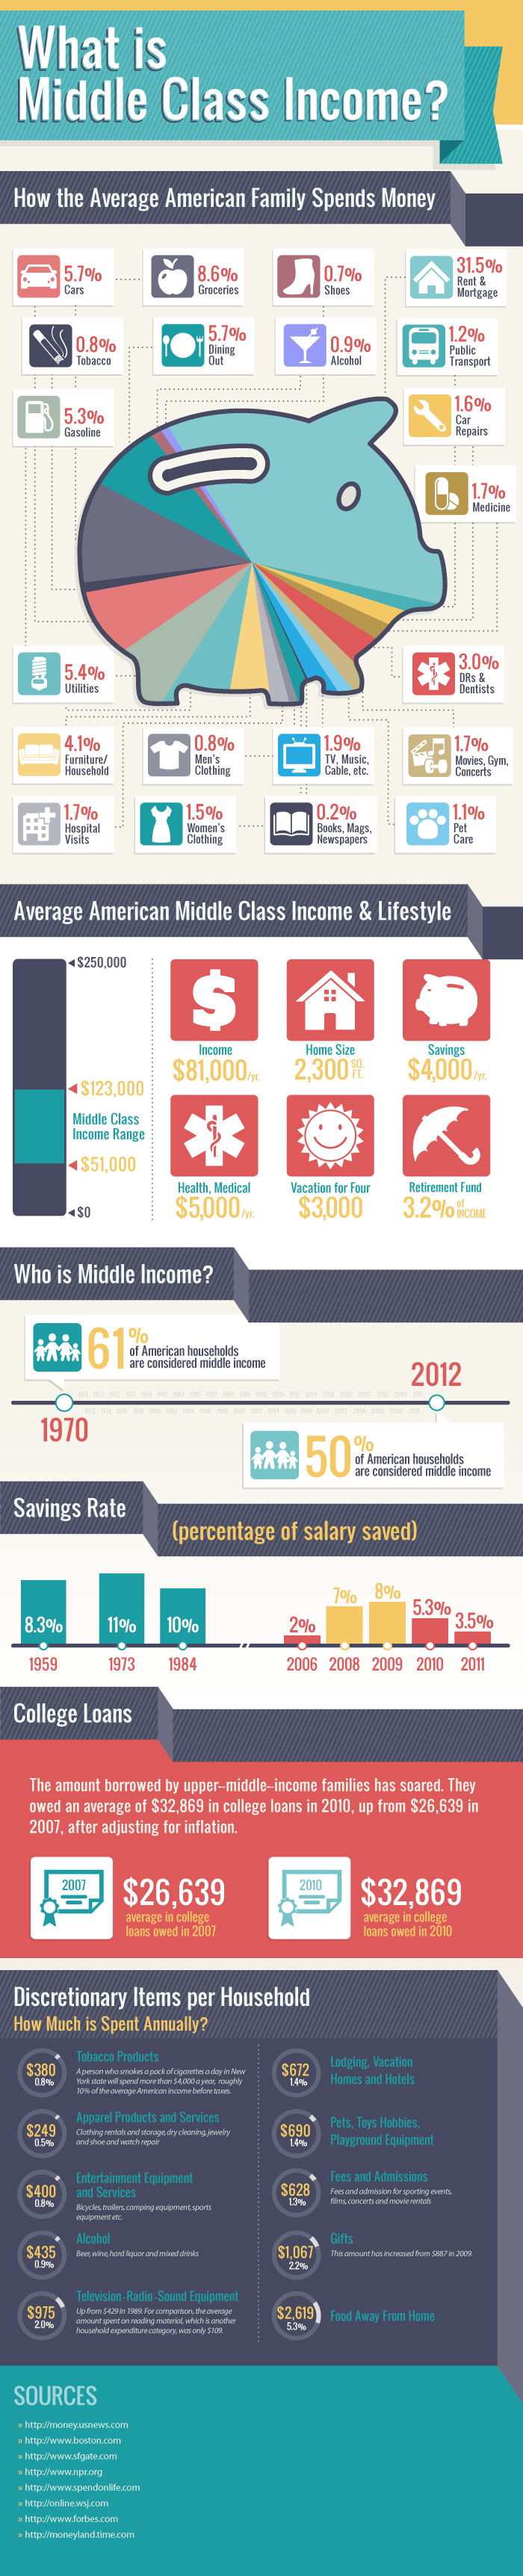
What is Middle Class Income
The below infographic outlines how the average American family spends their income and distributes it across their cost of living and lifestyle extras. A look at how much is spent annually on discretionary items is outlined.
Although millions of people visit Brandon's blog each month, his path to success was not easy. Go here to read his incredible story, "From Disabled and $500k in Debt to a Pro Blogger with 5 Million Monthly Visitors." If you want to send Brandon a quick message, then visit his contact page here.