Apps and Orange
This article seeks to make an uncommon comparison between the App Store and Google Play.
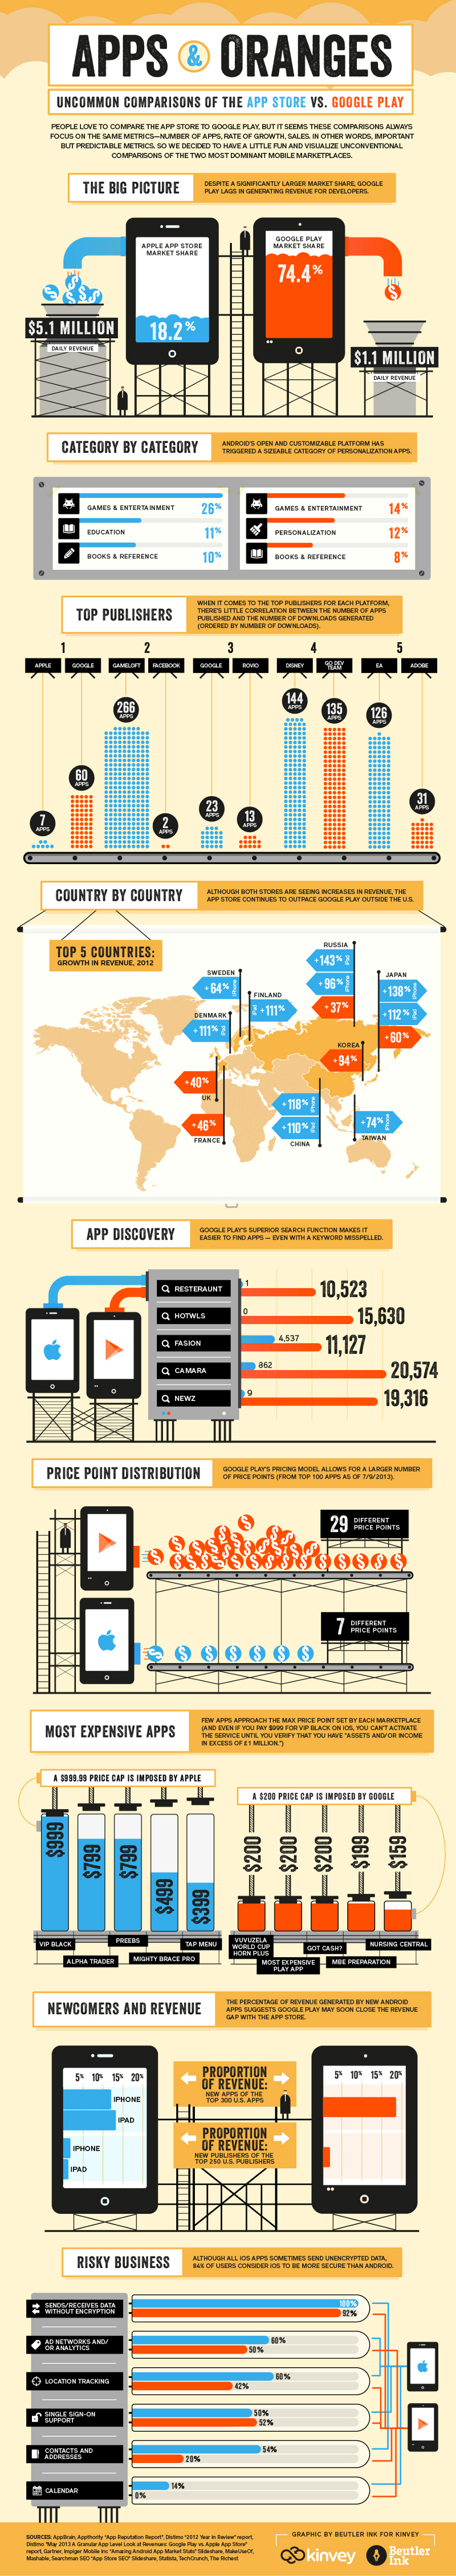
In the past, people compare the app store and Google Play. These comparison tend to concentrate on the same metrics such as the number of applications, rate of growth and sales. But here, we decided to approach this subject from a rather unconventional point of view.
The Bigger Pictures
It has been discovered that despite the significantly larger market share, Google lags behind in the generation of revenue for developers. Apple store has a market share of 18.2% and has a daily revenue of $5.1 million while Google has a market share of 74.4% and has a daily revenue of $1.1 million.
Category by Category
The open and customizable nature of Android application has made way for a sizable category of personalization of applications.
For Apple
Games and Entertainment has 26%
Books and Reference has 10%
Education has 11%
For Google
Games and Entertainment has 14%
Books and Reference has 8%
Personalization has 12%
Top Publishers
There is a little correlation between the number of apps and the number of downloads with respect to each platform.
1. With respect to Apple and Google, Apple has 7 apps downloads while Google has 60 apps download.
2. Between Gameloft and Facebook, Gameloft has 266 apps while Facebook has 2 apps.
3. For Google and Rovio, Google has 23 apps and Rovio has 13 apps.
4. Between Disney and Go Dev Team, Disney has 144 apps while Go dev team has 135 apps.
5. Between EA and Adobe, EA has 126 apps and Adobe has 31 apps.
Country by Country
Both stores are receiving revenues, the app store outperformed Google play outside the United States.
Russia
This country recorded over 143% of iPad, +96% in iPhone, and +37% for Google play.
Japan
iPad recorded +138% for iPhone, +112% for iPad and +60% for Google play.
Sweden
Sweden recorded +64% in iPhones, Finland +111% for the iPad and Denmark recorded +111% for the iPad also.
United Kingdom
United Kingdom recorded +40%, France recorded +46%.
China
Recorded +110% and +118% for the iPad and iPhone respectively.
Taiwan
Recorded +74% for the iPhone.
App Discoveries
In this area, Google is superior and makes it easier to find applications even when a keyword is misspelt.
Top Misspellings
1. Restaurant misspelt as resteraunt has 10,523 leads for Google and just one for Apple.
2. Hotel misspelt has Hotwls, Google has 15,630 leads while Apple has none.
3. Fashion misspelt as fasion, Google has 11,127 leads while Apple has just 4537.
4. Camera misspelt as camara, Google has 20,574 leads while Apple has just 862.
5. News spelt as Newz, Google has 19,316 leads while Apple just only 9.
Price Point Distribution
Google plays lots of pricing models, this allows for a larger number of price point from the top 100 apps. As of July 9th, 2013, while Google has 29 different price points, Apple has just 7 different price points.
Most Expensive Applications
The market price set by the market place is reached by a few applications. For Apple applications, a $999 price ceiling is imposed for a VIP black. For an Alpha trader, it is $799. For Preebs, it is $799, for mighty brace pro it is $499 and for tap menu, it is $399.
For Google, it is a $200 price ceiling for Vuvuzela world cup horn plus, $200 for the most expensive play app, $200 for got-cash, $199 for MBA preparation and $159 for nursing central.
Newcomer’s Revenue
From the look for things, Google play may soon catch up with the app store, this can be inferred from the revenue generated by Android.
With respect to the new apps of the top 300 apps in the US, iPhone has about 13% while iPad has 15%. Google play records about 20%.
With respect to the new publishers of the top 250 US publishes, Apple has less than 5% for both iPhone and iPad while Google also has less than 5%.
Risky Business
80% of users consider iOS to be secure as compared to Android, despite the fact that iOS applications sometimes send unencrypted data. Here is the analysis under various headings.
1. Send/Receive Data without Encryption: Apple scores 100% while Google play scores 92%.
2. Ad Networks and or Analytics: Apples scores 60% while Google scores 50%.
3. Location Tracking: Google scores 42% while Apple scores 60%.
4. Single Sign-on Support: Google has 52% while Apple has 50%.
5. Contacts and Addresses: Google has 54% while Apple has 20%.
6. For Calendar: Apple has 14% while Google has 0%.
Although millions of people visit Brandon's blog each month, his path to success was not easy. Go here to read his incredible story, "From Disabled and $500k in Debt to a Pro Blogger with 5 Million Monthly Visitors." If you want to send Brandon a quick message, then visit his contact page here.