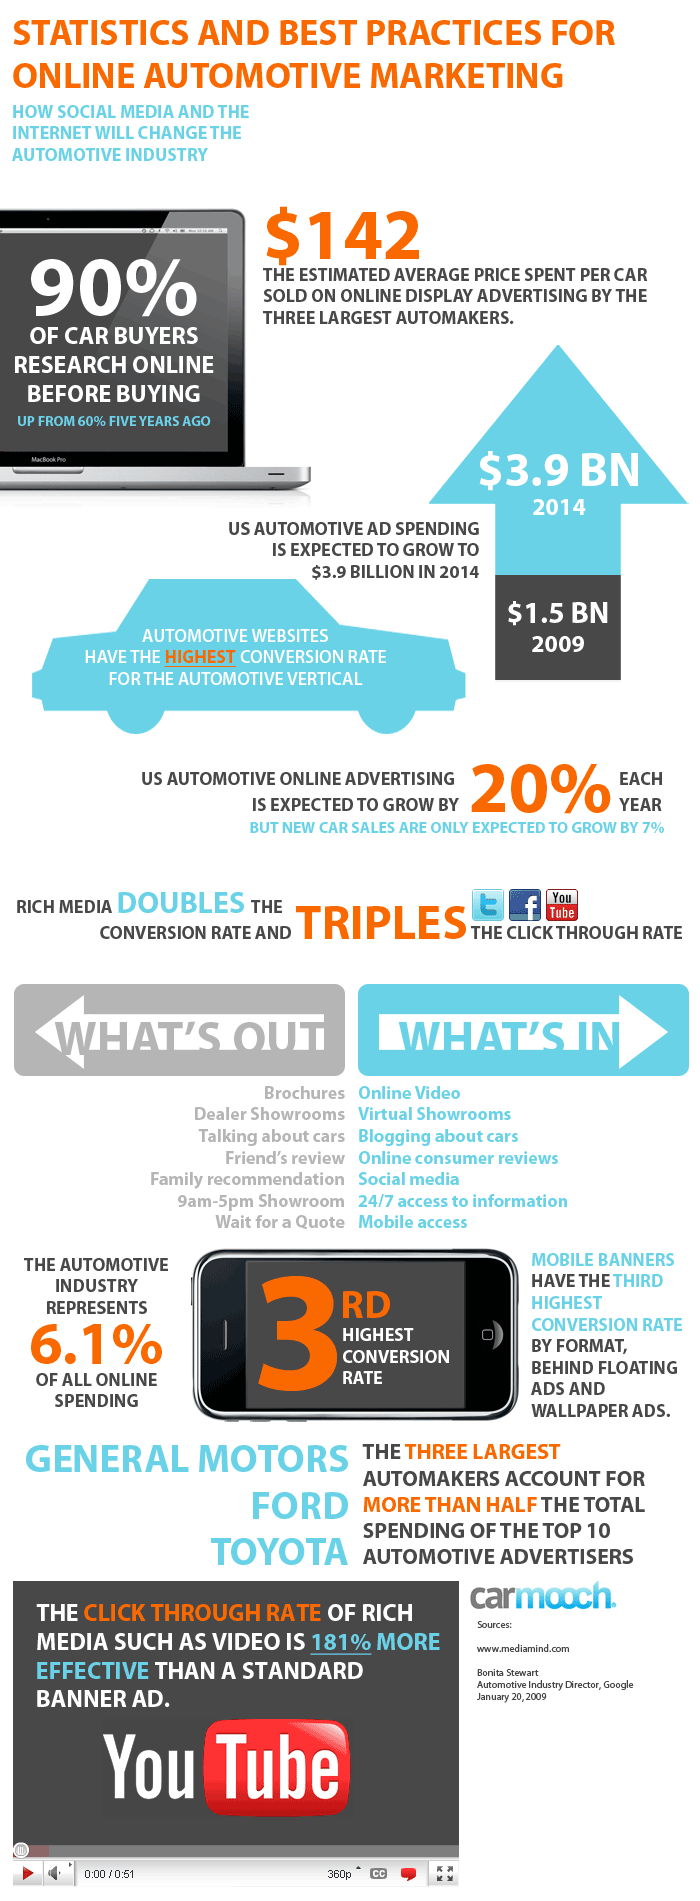
The auto industry generates loyalty or disloyalty more than virtually any other industry in the world today. Consumers will stick with a good brand or manufacturer of vehicle if that vehicle treats them in a good way and requires little maintenance. Once a bad taste gets in the mouth of a consumer, however, that manufacturer that provided a “bad” vehicle may never see a purchase again.
Top Automaker Statistics
The Top 10 automakers provide 80% of the vehicles that are on the road today.
That figure is even higher in the United States, where the Top 10 automakers are responsible for 90% of the vehicles that are on the road. Toyota and General Motors are typically the world leaders in vehicle sales year by year, each accounting for about 9 million vehicles sold on average each year. This represents about a 20% market share for each.
Key Facts That You Need to Know Right Now
1. By an agreement with the US government, most automakers have committed to creating vehicles that will have a fuel economy of at least 54 miles per gallon.
2. The average length of time that a vehicle remains on the road being used is 11.3 years.
3. For each mile per gallon that is increased on average, more than 70,000 barrels of oil can be used for other purposes.
Takeaway: Americans especially are looking for vehicles with better fuel efficiency simply because they often drive the most miles per capita than any other country in the world today. Good vehicles are needed to accomplish this, and because the market in the US is so extensive [the average household owns 2.8 vehicles in the US], automakers are bound to make agreements with the government, especially foreign automakers, so that the sales can keep coming. This might drive up car prices overall, but the ultimate goal is to lower fuel consumption, creating equality in long-term expenses for the average consumer.
Other Facts to Consider About This Industry
1. Ford predicted an 8% overall gain in sales for 2013, but realized just a 3% total gain in overall sales around the world.
2. Asian countries are expected to see a 40% growth in demand of automobiles in the next 7 years.
3. Ford expects to manufacture about half a million vehicles and engines in India by 2015, having spent more than $2 billion on infrastructure improvements.
4. Chinese automobile sales have increased by double digits every year for the last decade except for the economic downturn year of 2008 because of tax incentives for small cars.
5. Since 1999, more than 20 of the world’s largest suppliers of auto parts have filed for bankruptcy protection.
6. Up to 70% of the hybrid cars that are sold today are in the US market.
The global auto industry has some encouraging signs, but it also has quite a few disturbing sighs. Sales figures are up overall, but supporting companies are finding it difficult to stay in business in this industry. As fuel economies rise, cars will be expected to stay on the road for even longer periods of time, which may cause some auto sales to drop and provide more of a market for auto parts. Will the automakers jump into this industry to maintain sales? Or will parts suppliers be able to realize a comeback? Only time will tell.

Although millions of people visit Brandon's blog each month, his path to success was not easy. Go here to read his incredible story, "From Disabled and $500k in Debt to a Pro Blogger with 5 Million Monthly Visitors." If you want to send Brandon a quick message, then visit his contact page here.
