The original source of this infographic is theprblog.co.uk.
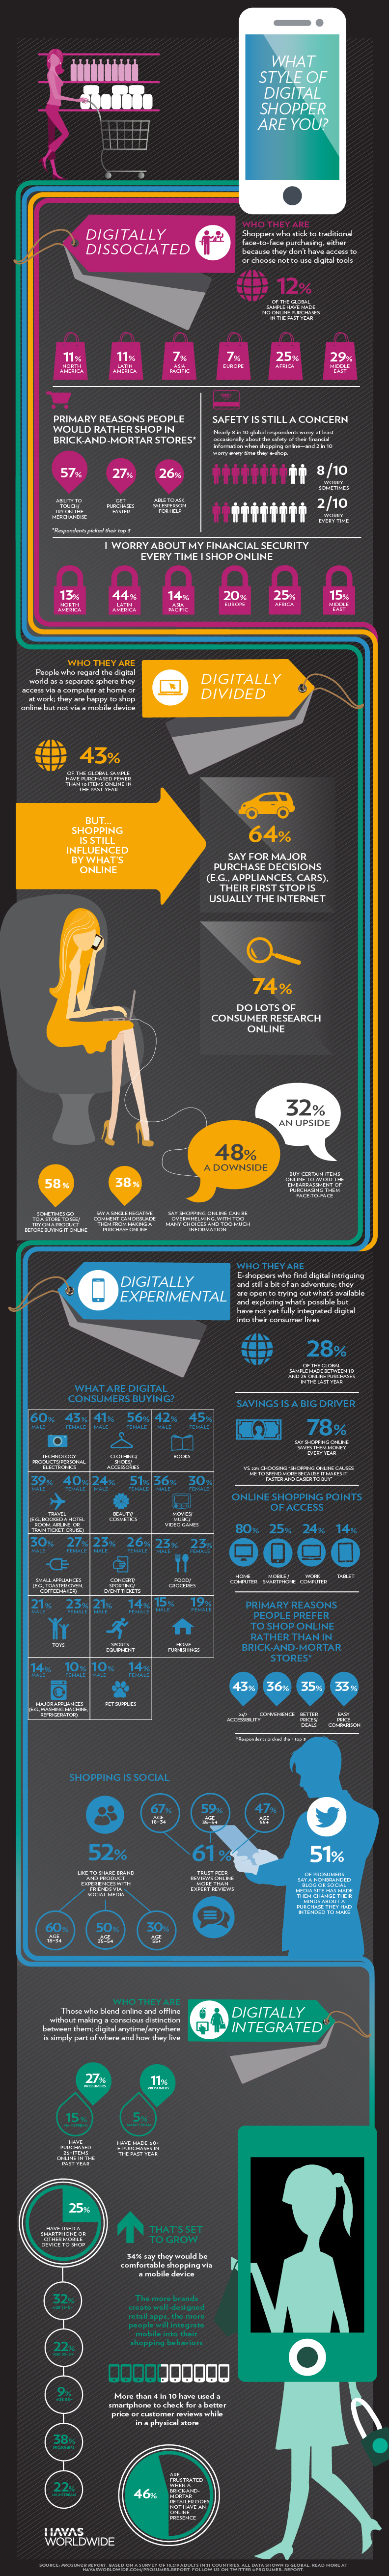
What Style of Digital Shopper Are You?
This article seeks to analyze the different types of shoppers. Look and see where you fall into.
Digitally Dissociated
There are shoppers that prefer face to face purchasing. This is because they do not have access to digital tools of modern day trends. This is reflected in the same sense that over 12% of the world’s population have not made purchases online in the past year. It was also discovered that the following percentage from the following countries are digitally disassociated. They are 11% of North Americans, 11% of Latin Americans, 7% of Asia Pacific, 7% Europe, 25% Africa, and 29% of the Middle East.
3 Reasons Why Clients Still Traditionally Shop
1. 57% want to have the physical feel of the item they are about to purchase.
2. 27% make the purchase much faster.
3. 26% are able to request for assistance from the sales person.
The survey revealed that safety is a concern for most of the respondents when they are shopping online. This was reflected in every 10 participants, 8 were concerned about the safety of their transaction data, while 2 worry every time.
Here is the breakdown of those who were worried about the safety every time from different continents of the globe.
13% of respondents from North America were worried every time they shopped online. 44% from Latin America, 14% from Asia Pacific, and 20% from Europe. Also, 25% from Africa and 15% from the Middle East.
Digitally Divided
These are users who see online shopping as a different world on its own. They are comfortable shopping using the computer but not a phone or any other mobile device. The survey revealed that about 43% of the global sampled population have purchased less than 10 items online in the last year. Over 64% admit to visiting the internet as the first point of call for major shopping like the purchase of a car, nevertheless, items available online influences the shopping of clients. 74% of the sampled population do some online research before making any purchases.
It was also discovered that about 32% prefer to make online purchases to avoid the embarrassment of a face to face interaction while 48% say the demands of online shopping is to much. 38% say the slightest negative remark can discourage them from making online purchases while 58% take time to visit the shop before they make purchase.
Digitally Experimental
These are shoppers who are adventurous. They maintain an open mind and they are experimental with digital products but they have not yet fully blended in to the trend. In this group, about 25 online purchases were made by 28% of the sampled population.
What are they spending their money on? 60% of males and 43% of females spend their money on technology based products and personal electronics. 41% of males and 56% of females spend on clothing, shoes, and accessories. 42% of males and 45% of females purchased books. For travel related purchases, 29% of males and 40% of females spent on this area, 24% of males and 51% of females spent on beauty and cosmetics while movies and video games were purchased by 36% of males and 30% of females.
Appliance like ovens and toasters were purchased by 30% males and 27% females, whole tickets for concerts and sporting events were purchased be 23% of males and 26% of females. 23% of both males and females purchased food and groceries while toys were purchased by 21% males and 23% females. Sports equipment were purchased by 14% of females and 21% of males while home and furnishings were purchased by 15% males and 19% females. Appliance like washing machines were purchased by 14% males and 10% females while shopping for pet supplies were made by 10% males and 14% females.
Here are some reasons why people prefer online shopping as compared to traditional shopping. 43% prefer it as a result of unlimited access, 26% prefer convenience, 35% say they have a better price deal while 3% say they can easily do some price comparison.
The research revealed that shopping is social. This is obvious from the fact that 51% of the sampled population said that social media and blogs has made them change their minds with respect to a particular purchase they were about to make. 61% of the global sample trusted the review of their peers online as compared to expert opinion. Of the percentage, 67% were between ages 18 to 34, 59% were between 35 to 54 while 47% were over 55 years of age. 52% like to share their experiences with respect to a product through social media. Of this percentage, 60% were aged 10 to 34, 50% were aged 35 to 54, while 30% were over 55 years of age.
Digitally Integrated
These are people who do not have a distinct distinction between online and offline. This has become their lifestyle. It has been discovered through research that 27% of pro consumers while 15% are main stream consumers. These are people who have made over 35 purchases online. 25% of the sampled population say they have used the smart phone to shop on different location. Of these, 32% are of ages 18 to 34, 22% are of ages 35 to 54, 9% are over 55 years and 38% are pro consumers.
34% of the sampled population say they are comfortable shopping with a mobile device. This can be promoted by developing more applications for people to shop online. This will integrate the mobile shopping behavior. It was also discovered that for every 10, 4 use smart phones to do some online research while they are physically present in the shop. It was also discovered that 46% of shoppers are uncomfortable when traditional retailers are not present online.
Although millions of people visit Brandon's blog each month, his path to success was not easy. Go here to read his incredible story, "From Disabled and $500k in Debt to a Pro Blogger with 5 Million Monthly Visitors." If you want to send Brandon a quick message, then visit his contact page here.