Telecom Industry Statistics and Trends
The telecommunications industry is worth a total of $1.2 trillion in the United States. Global spending is estimated to be worth $5 trillion. US consumers are looking at their devices more than 9 billion times a day in the aggregate–up 13 percent from last year. This is broken down into the following market shares and their value.
Market Share and Revenue
Landline
• 141 million total service connections made in the United States.
• 1.17 billion landline connections worldwide.
• There are 16.5 landlines per every 100 people.
Wireless
• $185 billion in revenue for wireless services in the United States.
• 326.4 million connections are made in the United States.
• 102.2% of market penetration occurred.
• 6.8 billion mobile subscriptions made worldwide.
• $1.7 billion in mobile phone sales.
• 675 million smartphone units sold.
Equipment
• $33.8 billion exports performed for related equipment.
• $93.2 billion imports performed for related equipment.
TV, Cable, and Internet
• 2.7 billion global internet users.
• 56 million basic subscribers for TV cable.
• 35 million satellite TV subscribers.
Employment
• 858,100 employed in the telecommunications industry within the United States.
Snapshot of Telecom Industry
The current state of the telecom industry due to influences from science, technology, and innovation policies.
Worldwide Internet Usage
The following percentages of age groups have access to the internet worldwide. An estimated 1.9 billion are not online.
World
Over 25 years old: 34% use the internet.
Under 25 years old: 36% use the internet.
Developing
Over 25 years old: 23% use the internet.
Under 25 years old: 30% use the internet.
Developed
Over 25 years old: 71% use the internet.
Under 25 years old: 77% use the internet.
Top 10 Broadband Economies
The following listing is of the top 10 countries that lead in broadband connectivity reaching a market penetration of 26% to 54%. Subscription rates are based on per 100 inhabitants.
1. Netherlands – 38.1
2. Switzerland – 37.9
3. Denmark – 37.7
4. Republic of Korea – 35.7
5. Norway – 35.3
6. Iceland – 34.1
7. France – 33.9
8. Luxembourg – 33.2
9. Sweden – 31.8
10. Germany – 31.7
Telecommunications Employment in the United States
The top occupations seen in the telecom industry with the following annual mean salaries are listed below from highest to lowest.
1. Electronics Engineers (Non Computer ) – $85,840
2. First Line Supervisors – $62,590
3. Telecommunications Line Installers and Repairers – $57,410
4. Telecommunications equipment installers and repairers – $55,430
5. Telephone Operators – $38,400
6. Customer Service Representatives – $37,160
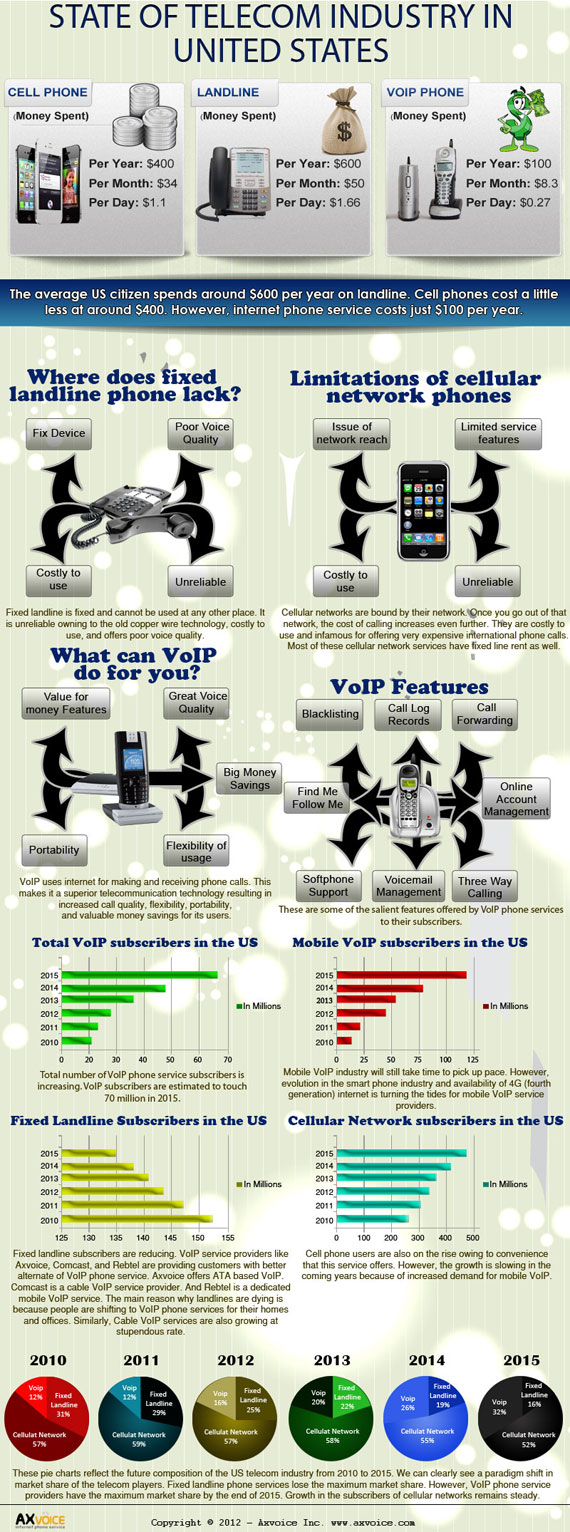
Current State of the Telecom Industry
A statistical outlook of the telecom industry is outlined in the following infographic. Statistics of total subscribers and changing trends are outlined.
Although millions of people visit Brandon's blog each month, his path to success was not easy. Go here to read his incredible story, "From Disabled and $500k in Debt to a Pro Blogger with 5 Million Monthly Visitors." If you want to send Brandon a quick message, then visit his contact page here.